User Guide
Rackspace Kubernetes-as-a-Service
Last updated: Feb 11, 2022
Rackspace Kubernetes-as-a-Service (Rackspace KaaS) enables IT operators to run Kubernetes® clusters on top of the following new or existing environments:
- Rackspace Private Cloud powered by OpenStack (RPCO)
- Rackspace Private Cloud powered by Red Hat (RPCR)
- Amazon® Elastic Kubernetes Services (EKS)
This document provides information for IT operators who use Kubernetes as a part of their cloud solution and describes the specifics of Rackspace KaaS.
For information about how to use Kubernetes, see Kubernetes documentation.
- Preface
- Introduction
- Services overview
- Services technical details
- Using Rackspace KaaS
- Document history and additional information
- Disclaimer
Preface
Rackspace offers 24x7x365 support for Rackspace Kubernetes-as-a-Service (KaaS). To learn about support for your cloud or to take advantage of our training offerings, open a support ticket or contact your Account Manager.
Introduction
Kubernetes is a software tool that helps you better orchestrate and manage your cloud, simplify cloud operations, and lower the cost of cloud computing expenses. Kubernetes and containerized applications simplify deployment, scaling, and management, making applications portable across different compute environments for development, testing, and production.
Configuring a fully operational production Kubernetes cluster is challenging and requires specific expertise in container management, networking, storage, security, and other aspects of a production cloud. You also need appropriate tooling, automation, processes, expertise, and infrastructure. Organizations often decide to outsource this work to cloud providers who specifically focus on complex cloud systems.
With Rackspace KaaS, our experts deliver ongoing operations management and support for the entire technology stack–from the hardware and infrastructure-as-a-service (IaaS) to Kubernetes itself. We manage and support the containers and cluster application services such as monitoring, logging, analytics, and more. Use Rackspace KaaS to manage highly available application environments and handle scheduling, scaling, load balancing, and distribution.
Rackspace KaaS enables you to run Kubernetes workloads on top of EKS, RPCR, or RPCO v14 or later. You can request a Rackspace KaaS installation for an existing or new environment.
Services overview
Your Kubernetes cluster has basic functionality and comes with optional managed services that provide extra features.
Warning
Rackspace KaaS uses the rackspace-system and kube-system namespaces in Kubernetes for managed services. Do not modify any resources in these namespaces.
Rackspace KaaS provides the following optional managed services:
- Custom cluster hardening
- SSL Certificate management
- External DNS management
- Ingress management
- Integrated Authentication
- Logging
- Container image registry
- Backup
- Monitoring
- Kubernetes Dashboard
- ServiceMesh
Custom cluster hardening
The custom cluster hardening service applies industry best practice hardening to your Kubernetes cluster. This hardening secures your workloads by enforcing Pod Security Policies (PSPs) that prevent privileged workloads from running by default.
For technical details, see Cluster hardening.
SSL Certificate management
The Secure Sockets Layer (SSL) certificate management foundational service automatically provides SSL certificates for web-based managed services.
SSL certificate management provides automatic SSL/TLS certificate provisioning for your workloads by using Let’s Encrypt. This service allows you to programmatically request, deploy, and automatically renew certificates with no financial or operational costs.
For technical details, see Certificate management.
External DNS management
The external Domain Name Service (DNS) management foundational service integrates with cloud-native DNS, providing a way to reach web-based managed services.
This service synchronizes hostnames for exposed services and ingresses with DNS providers, which allows you to create and update DNS records programmatically from within Kubernetes.
For technical details, see DNS management.
Ingress management
The Ingress controller service configures Nginx services by using Ingress resources. This service enables you to expose services outside of Kubernetes programmatically by using hostnames and paths, and configure HTTP proxying parameters so that you can reach managed services from outside the cluster.
For technical details, see Ingress management.
Integrated Authentication
Integrated authentication consists of two components:
- Kubernetes Access Manager (KAM)
- Dex
KAM
The Kubernetes Access Manager (KAM) is a custom Rackspace component through which you get secure, cloud-idiomatic access to the kubectl command.
KAM extends Dex, Kubernetes integration, and user onboarding by providing temporary access credentials and kubeconfig files for the cluster. These resources allow your users to retrieve Kubernetes credentials automatically through a secure portal that leverages their Identity Provider credentials.
Dex
Customer authentication back-end services, such as ones that use Security Assertion Markup Language (SAML), Lightweight Directory Access Protocol (LDAP), and so on, plug into the single authentication layer foundational service. Use this service for authentication for cluster and managed service authentication.
This service integrates with your Identity Provider, such as Okta, Ping, ADFS, and so on, to provide OpenID Connect (OIDC)-based Single Sign On (SSO). This functionality allows the Rackspace managed services to authenticate your users by using a centralized identity service.
For technical details, see Integrated authentication.
Logging
The logging service provides a complete logging stack for Rackspace managed services and customer applications.
Implemented by using tools such as Elasticsearch™, for storage, Fluentd™, for log file ingestion, and Kibana™, for viewing, the logging service integrates with Kubernetes to provide real-time data analytics and system resource utilization statistics of your cloud and your Kubernetes workloads.
For technical details, see Logging.
Container image registry
The container image registry, Harbor, is a cloud-native, private, on-cluster registry for container images that stores, signs, and scans Docker images. In addition to the public Docker image registry, you can store and manage your own Docker images in a private registry implemented with VMware Harbor. This registry allows your users to upload, share, and collaborate on Docker images and Helm charts by using a private, secure registry.
For technical details, see Image Registry.
Backup
The backup service, Velero™, provides a programmatic way to backup, migrate, and restore Kubernetes cluster resources and persistent volumes. This service enables you to configure backup schedules and restorations for Kubernetes components.
For technical details, see Backup.
Monitoring
The monitoring service, Prometheus™, provides a monitoring stack into which you can plug your applications.
For cloud administrators to diagnose and address any issues, production clouds need performance and uptime monitoring. The Rackspace KaaS monitoring stack integrates such tools as Prometheus and Grafana® with Kubernetes to enable Rackspace operators to track the health of your cloud. We provide service and performance monitoring (Prometheus), alerting (Alert Manager), and visualizing (Grafana). These services allow your users to manage monitoring and alerting for their applications programmatically.
For technical details, see Monitoring.
Kubernetes Dashboard
The Kubernetes Dashboard, a web-based user interface, provides access to Kubernetes clusters for RPCO or RPCR. It enables to perform the following tasks:
- Create or modify cluster resources
- Deploy applications to a cluster
- Troubleshoot applications in a cluster
You can also check on the state of your cluster and the resources to identity errors or other conditions.
For technical details, see Dashboard.
ServiceMesh
The servicemesh service, Istio, provides a way to connect, manage, and secure microservices. This service enables your users to manage the traffic flow, enforce policies, and collect telemetry data across Kubernetes services programmatically.
For technical details, see ServiceMesh.
Services Technical details
This section provides technical details for the Rackspace KaaS services and tools that help you to manage your Kubernetes clusters.
- Backup
- Certificate management
- Cluster hardening
- DNS management
- Image Registry
- Ingress management
- Integrated authentication
- Logging
- Monitoring
- Dashboard
- ServiceMesh
Backup
Disaster recovery is an integral part of any robust production system. In a Kubernetes environment, you have master, worker, and etcd nodes, and each of these servers runs multiple stateless and stateful components.
The Rackspace KaaS automation tools automatically enables stateless components that run on Kubernetes master and worker nodes to restore themselves.
Rackspace KaaS uses VMWare™ Velero to back up stateful components, such as etcd, which stores a cluster’s data and persistent volumes that contain persistent data for your applications.
Rackspace KaaS uses Velero to create snapshots of persistent volumes and automatically back up the cluster data, which you can use to recover from a cluster failure.
Documentation links
Use the following links to learn more:
Implementation details
In EKS, Velero integrates with EC2 and S3 to snapshot persistent volumes and store configuration backups.
In RPCO and RPCR, Velero integrates with Nova and Ceph to take snapshots of persistent volumes and store configuration backups.
Specific usage instructions
There are currently no specific usage instructions for the Rackspace KaaS Backup service.
Certificate management
To protect your data from security threats, Rackspace KaaS ensures that all connections between the internal components and external systems are compliant with the cloud industry best practices by using Secure Sockets Layer (SSL) and SSL certificates. Rackspace KaaS uses OpenSSL self-signed certificates for the various components of the Rackspace KaaS deployment.
In a secure system, components communicate with each other by sending secure messages that are signed by a certificate authority (CA), a third-party that verifies the identities of the communicating parties. If one component needs to talk to an unfamiliar component, it confirms that component’s identity by using a CA that is known to both of these components. If the first component cannot confirm the identity of the second component, it refuses the connection.
Rackspace KaaS uses the Kubernetes cert-manager to help issue Rackspace KaaS certificates from appropriate CAs, make sure certificates are valid and up-to-date, and attempt to renew certificates.
Documentation links
Use the following links to learn more:
Implementation details
In EKS, cert-manager integrates with Amazon Route53 for automatic, DNS-based certificates.
In RPCO and RPCR, cert-manager uses a self-signed CA. Customers can use cert-manager to request valid Lets Encrypt certificates that use HTTP for ingress resources.
Specific usage instructions
There are currently no specific usage instructions for the Rackspace KaaS Certificate Management service.
Cluster hardening
Rackspace KaaS uses Kubernetes Pod Security Policies (PSP) to perform cluster hardening and provide security for your cluster. PSPs, a list of security rules, enable administrators to configure what pods can access and what they can do.
Documentation links
Use the following link to learn more:
Implementation details
Rackspace KaaS creates two PSPs by default: privileged and restricted.
The default restricted PSP prevents common security problems such as users who run as root or mounting host resources.
The privileged PSP is unrestricted and permits a pod to perform all actions.
Specific usage instructions
To use the privileged PSP, create a service account for the deployment and create a RoleBinding for the service account, granting it access to the privileged-psp ClusterRole.
For more information, see Configure pod security policies.
DNS management
Your Kubernetes cluster comes with ExternalDNS, which enables you to manage DNS records through simple annotations on an Ingress resource.
ExternalDNS runs in a pod and talks directly to the cloud provider so that Ingress resources can manage the records of any zone delegated to your cloud’s DNS service.
Troubleshooting
You can view the ExternalDNS logs by running the following command:
$ kubectl logs deployments/external-dns -n rackspace-system
Documentation links
Use the following links to learn more:
Implementation details
There are currently no specific implementation details for the Rackspace KaaS DNS management service.
Specific usage instructions
In this example, a Pod runs and exposes an application on port 8080 through a Service named my-app-service. The following code sample shows a possible Ingress resource for this application. Note the external-dns.alpha.kubernetes.io/hostname annotation, which ExternalDNS looks for in its control loops.
apiVersion: extensions/v1beta1
kind: Ingress
metadata:
  name: my-app-ingress
  annotations:
    kubernetes.io/ingress.class: nginx
    external-dns.alpha.kubernetes.io/hostname: my-app.my-domain.com
spec:
  rules:
  - host: my-app.my-domain.com
    http:
      paths:
      - path: /
        backend:
          serviceName: my-app-service
          servicePort: 8080
Image Registry
In addition to using public Docker® image registries from Docker, Quay®, or others, your Kubernetes cluster is configured to use an internal, secure, and private Docker registry instance implemented by VMware Harbor. Harbor includes many enterprise-class features, including Role-Based Access Control (RBAC) and image vulnerability scanning with Clair that provides an additional level of security to your images.
Log in to the Harbor UI by clicking the Log in via OIDC Provider button on the registry login page. Harbor redirects you to your configured identity provider, where you need to use your Identity Provider’s credentials to authenticate.
The registry has a default project called library. You might want to store all your base images used by developers and operators in this project. By default, the library project is publicly visible, which enables any user to pull images from it. However, only the cloud provider admin user can push images to this project. If you want to enable other users to push images to this project, see Managing Projects.
Documentation links
Use the following links to learn more:
Implementation details
There are currently no specific implementation details for the Rackspace KaaS image registry service.
Specific usage instructions
This section contains examples of using the Docker registry and using Harbor.
Use Docker
This section provides examples of how to use the Docker registry. When you work with a Docker registry, you use the push and pull commands to upload and download images. The examples below provide more information about how to pull and push Docker images into the Docker registry.
Example of private Docker registry usage
This section shows how to use the internal Docker registry with Docker images. This example uses a container of a lightweight, general-purpose Linux distribution called Alpine Docker. The example includes the following tasks:
- Download the Alpine Linux Docker image from DockerHub.
- Tag it with the internal Docker registry.
- Upload the tag to the internal registry.
- Create a secret file for the Docker registry.
- Create a deployment for Alpine Linux.
- Log in to the Docker registry.
$ docker login -u ${CLOUD_PROVIDER_USERNAME} -p ${RS_K8S_TOKEN} registry.${K8S_DOMAIN}
System response:
Login Succeeded
- Download the Alpine Linux Docker image from the registry.
$ docker pull alpine
System response:
Using default tag: latest
latest: Pulling from library/alpine
Digest: sha256:58e1a1bb75db1b5a24a462dd5e2915277ea06438c3f105138f97eb53149673c4
Status: Image is up to date for alpine:latest
- Tag the Alpine Linux image with the local Docker registry.
$ docker tag alpine registry.${K8S_DOMAIN}/${CLOUD_PROVIDER_USERNAME}/alpine
- Upload the tag to the local Docker registry.
$ docker push registry.${K8S_DOMAIN}/${CLOUD_PROVIDER_USERNAME}/alpine
System response:
The push refers to a repository [registry.${K8S_DOMAIN}/${CLOUD_PROVIDER_USERNAME}/alpine]
404361ced64e: Pushed
latest: digest: sha256:3de22c9f3a98b60a295781c201f1d7b2cd1c16601c89a9ad5842bdc8462d1fc3 size: 528
- Create a secrets file for the local Docker registry.
$ kubectl create secret docker-registry docker-registry-creds \
 --docker-server="registry.${K8S_DOMAIN}" \
 [email protected] \
 --docker-username=${CLOUD_PROVIDER_USERNAME} \
 --docker-password=${RS_K8S_TOKEN}
System response:
secret "docker-registry-creds" created
- Create a deployment called alps.
$ cat <<EOF | kubectl apply -f -
apiVersion: extensions/v1beta1
kind: Deployment
metadata:
  name: alps
spec:
  template:
    metadata:
      labels:
        k8s-app: alps
    spec:
      containers:
      - name: alps
        image: registry.${K8S_DOMAIN}/${CLOUD_PROVIDER_USERNAME}/alpine
        command: ["/bin/sh","-c","echo 'Napping...' && sleep 10000"]
      imagePullSecrets:
        - name: docker-registry-creds
EOF
deployment "alps" created
- View the pods created for this deployment.
$ kubectl get pods
System response:
NAME                    READY     STATUS    RESTARTS   AGE
alps-334303239-njpt3    1/1       Running   0          13s
- View the logs for the pod.
$ kubectl logs alps-334303239-njpt3
System response:
Napping...
- Use the
get eventscommand for this image to view detailed information about the deployment:
$ kubectl get events | grep alps | grep image
System response:
57s        57s         1         alps-1298207271-njpt3   Pod          spec.containers{alps}   Normal    Pulling             kubelet, etoews-worker-1   pulling image "registry.${K8S_DOMAIN}/${RS_OS_USERNAME}/alpine"
56s        56s         1         alps-1298207271-njpt3   Pod          spec.containers{alps}   Normal    Pulled              kubelet, etoews-worker-1   Successfully pulled image "registry.${K8S_DOMAIN}/${RS_OS_USERNAME}/alpine"
- When done testing, delete your deployment:
$ kubectl delete deployment alps
System response:
deployment "alps" deleted
Example of the library project usage
This example is similar to Example of private Docker registry usage, but because you use the public library project, you do not need to create a secrets file.
- Source credentials.sh:
source credentials.sh
- Log in to the Docker registry.
$ docker login -u ${CLOUD_PROVIDER_USERNAME} -p ${RS_K8S_TOKEN} registry.${K8S_DOMAIN}
System response:
Login Succeeded
- Download the Alpine Linux Docker image from the registry.
$ docker pull alpine
System response:
Using default tag: latest
latest: Pulling from library/alpine
Digest: sha256:58e1a1bb75db1b5a24a462dd5e2915277ea06438c3f105138f97eb53149673c4
Status: Image is up to date for alpine:latest
- Tag the Alpine Linux image with the local Docker registry.
$ docker tag alpine registry.${K8S_DOMAIN}/library/alpine
- Upload the tag to the local Docker registry.
$ docker push registry.${K8S_DOMAIN}/library/alpine
System response:
The push refers to a repository [registry.${K8S_DOMAIN}/library/alpine]
404361ced64e: Pushed
latest: digest: sha256:3de22c9f3a98b60a295781c201f1d7b2cd1c16601c89a9ad5842bdc8462d1fc3 size: 528
- Create a deployment called alps.
$ cat <<EOF | kubectl apply -f -
apiVersion: extensions/v1beta1
kind: Deployment
metadata:
  name: alps
spec:
  template:
    metadata:
      labels:
        k8s-app: alps
    spec:
      containers:
      - name: alps
        image: registry.${K8S_DOMAIN}/library/alpine
        command: ["/bin/sh","-c","echo 'Napping...' && sleep 10000"]
      imagePullSecrets:
        - name: docker-registry-creds
EOF
deployment "alps" created
- View the pods created for this deployment.
$ kubectl get pods
System response:
NAME                    READY     STATUS    RESTARTS   AGE
alps-334303239-njpt3    1/1       Running   0          13s
- View the logs for the pod.
$ kubectl logs alps-334303239-njpt3
System response:
.. code-block:: bash

   Napping...
- Use the
get eventscommand for this image to view detailed information about the deployment:
$ kubectl get events | grep alps | grep image
System response:
57s        57s         1         alps-1298207271-njpt3   Pod          spec.containers{alps}   Normal    Pulling             kubelet, etoews-worker-1   pulling image "registry.${K8S_DOMAIN}/library/alpine"
56s        56s         1         alps-1298207271-njpt3   Pod          spec.containers{alps}   Normal    Pulled              kubelet, etoews-worker-1   Successfully pulled image "registry.${K8S_DOMAIN}/library/alpine"
- When done testing, delete your deployment:
kubectl delete deployment alps
System response::
deployment "alps" deleted
Use Harbor
To set up your cluster to work with VMware Harbor, perform the following steps:
- Generate a token as described in Access your Kubernetes cluster with kubectl.
- Log in to the Harbor registry UI at
https://registry.${K8S_DOMAIN}by using your Identity Provider credentials. - Create a registry project for your repositories and images by using the following steps:
- In the left-hand navigation panel, click Projects.
- Click +Project.
- Use the value of
CLOUD_PROVIDER_USERNAMEfor your project name. - Select whether the project is public or private.
Add users to a Harbor project
You can create public and private Harbor projects. While public projects are visible to all users, only members can see and use private projects.
You can add Identity Backend users to your Harbor project, remove the users, and assign privileges to them by using the Harbor UI. Harbor does not receive any role-based access control (RBAC) information from the Integrated authentication services. Therefore, you do not need to configure users on the Identity Backend. However, before you can add an Identity Backend user to a Harbor project, you need to log in to the Harbor UI as that user at least one time.
You can assign one of the following roles to a user in a Harbor project:
- Guest: Enables users to pull Docker images from the Harbor registry.
- Developer: Enables users to pull and push Docker images to and from the Harbor registry.
- Project Admin: Enables users to perform any actions with Docker images, as well as add and remove members from the project.
To add users to a Harbor project, use the following steps:
-
Log in to and log out from the Harbor UI using the user account that you want to add to the Harbor project.
-
Log in to the Harbor UI as the Harbor project administrator or as a Rackspace KaaS cluster administrator.
-
Select the project.
-
Click Members > +New Member.
-
Type the username and select a role.
-
Click OK.
Note
If you get the Username does not exist error message, verify that the user exists in your Identity Backend. Then, log in to and log out from the Harbor UI with that user.
Ingress management
Rackspace KaaS uses Ingress to manage external accesss and traffic into the services in your cluster by applying rules that you define on the Ingress resource. To learn more, see the Ingress documentation.
Documentation links
Use the following links to learn more:
Implementation details
There are currently no specific implementation details for the Rackspace KaaS Ingress management service.
Specific usage instructions
There are currently no specific usage instructions for the Rackspace KaaS Ingress management service.
Integrated authentication
Integrated Authentication allows Rackspace to configure clusters to connect and authenticate against customer-provided Identity Services, such as ones that use Security Assertion Markup Language (SAML), Lightweight Directory Access Protocol (LDAP), and so on. Examples of configurable Identity backends include Okta, Ping, and ADFS.
Using Integrated Authentication enables users to authenticate to Rackspace managed services by using a customer identity from a centralized service.
KAM
The Kubernetes Access Manager (KAM) is a custom Rackspace component through which you get secure, cloud-idiomatic access to the kubectl command.
KAM is a component of Integrated Authentication that provides temporary access credentials and kubeconfig files for the cluster. These resources allow your users to retrieve Kubernetes credentials automatically through a secure portal that leverages their Identity Provider credentials. The user must already be a member of the cluster-admin group that is defined in your Identity Provider to get credentials for the cluster.
Note
Customers must set up and define the cluster-admin group within their Identity Providers themselves. Rackspace cannot assist with this process.
Access KAM
To access KAM for your cluster on RPCO, access the following URL, substituting your cluster name and DNS domain:
https:\\kam.yourclustername.rpc.rackspace.com
To access KAM for your cluster on EKS, access the following URL, substituting your cluster name and DNS domain:
https:\\kam.yourclustername.eks.rackspace.com
With EKS, KAM uses the AWS Identity and Access Management (AIM) system add-on, kube-to-AIM, to take advantage of the built-in Role-based Access Controller (RBAC) system to scope access to users and roles. If EKS users try to use a managed service without the appropriate authorization, they get an error. KAM, in an EKS cluster, scopes the services to the user roles in AIM.
With RPCO, anyone with access to the cluster automatically has access to all the services on the cluster.
Authentication
When you go to the KAM portal for your cluster, a login prompt displays for your company’s Identity Provider, such as Keystone for RPCO, by using your corporate credentials. The Identity Provider then returns the list of the cluster-admin groups of which you are a member.
After you log in, choose the group for which you need credentials and click GET CREDENTIALS.
If you are not a member of the admin group for the cluster, as soon as you log in to KAM you get an authentication error saying that you are not a member of any groups for the cluster. Ask your Identity Provider to add you to the group if you need access.
If you are a member of a group, the credentials display in the form of a kubeconfig file that you can use to run kubectl commands on the cluster. kubectl uses the contents of the kubeconfig file to authenticate the specified user by using the specified authentication method.
Copy the credentials and paste them into a new kubeconfig file for your cluster. If you have an existing kubeconfig file, replace the contents with the new credentials. You should store the file in your home directory, such as ~/.kube/rackspace/kubeconfig. You might need to create this path.
Use the following structure to specify the kubeconfig file to use for your kubectl commands, replacing the kubeconfig filename with the one that you created, the namespace with your namespace, and the command with the operation you want to perform:
kubectl --kubeconfig=yourkubeconfigfile -n yournamespace kubectl-command
You can also run the following command to set the KUBECONFIG environment variable with the config file name so that you don’t need to specify it in each kubectl command:
$ export KUBECONFIG=~/.kube/rackspace/kubeconfig
Dex
Rackspace uses Dex as an Identity Service to connect the customer identity to Rackspace Managed Services and KAM. Dex is an Identity Service that uses OpenID Connect to drive authentication for other applications.
Documentation links
There are no external links for KAM or Dex.
Implementation details
There are currently no specific implementation details for KAM or Dex.
Specific usage instructions
To access KAM, see Access KAM.
To authenticate with KAM, see Authentication.
Logging
Rackspace KaaS provides state-of-the-art monitoring and logging tools to deliver the best user experience out-of-the-box. Proactive monitoring helps you detect problems early and act fast to ensure successful cloud infrastructure operations.
Log in to the logging and monitoring dashboards by using the URLs and credentials listed in Access the Rackspace KaaS dashboards. The provided credentials grant you read and write access to the Kibana and Grafana dashboards.
For RPCO users, Rackspace KaaS stores the Managed Services credentials for your cluster in the //generated/auth/credentials.sh file.
Elasticsearch™, Fluentd™, and Kibana™, or EFK stack, is an industry standard for collecting, storing, and visualizing Kubernetes logs. Fluentd collects the Kubernetes containers logs and transmits them to Elasticsearch. Elasticsearch stores the logs and exposes them through a RESTful API. Kibana provides a graphical representation of the collected logs along with filtering and search capabilities. Rackspace KaaS deploys all components of EFK as Kubernetes Pods in the rackspace-system namespace.
Elasticsearch retains logs and data for seven days by default. If your organization requires you to store such information for a more extended period, contact your Rackspace representative or submit a support ticket.
Documentation links
Use the following links to learn more about EFK stack logging configuration:
Implementation details
There are currently no specific implementation details for the Rackspace KaaS Logging service.
Specific usage instructions
This section shows an example how to use Kibana.
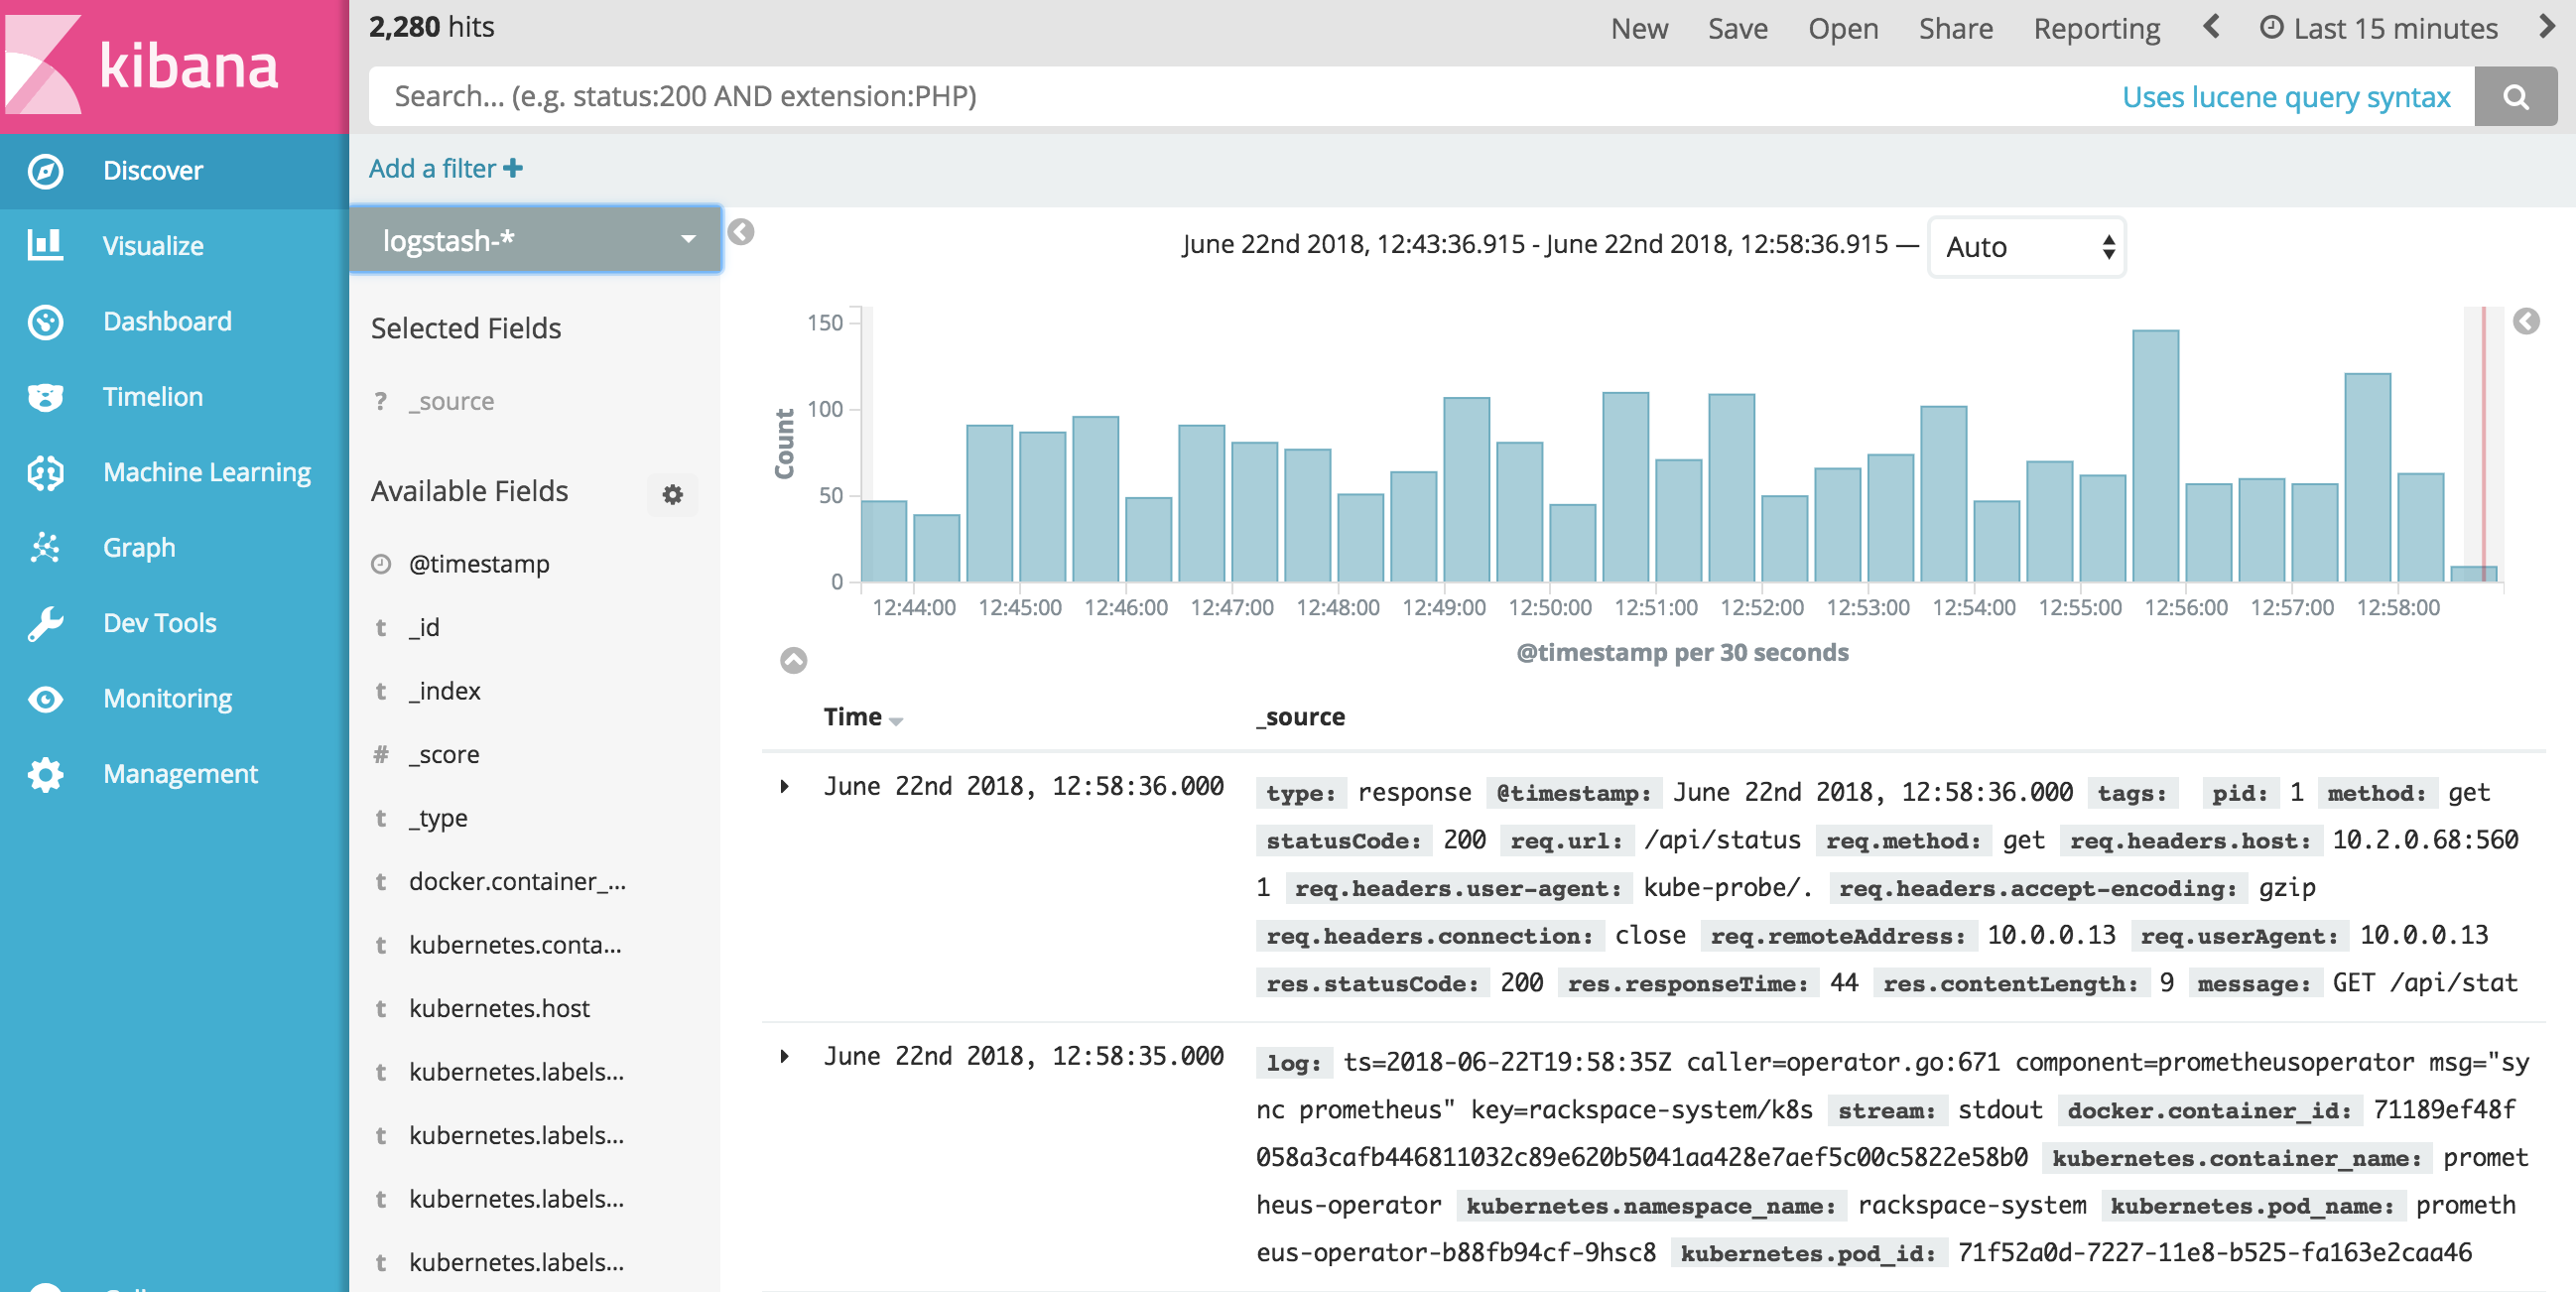
Use Kibana
You can access Kibana by using your Managed Services credentials and the URL listed in Access the Rackspace KaaS dashboards. To view and visualize the logs, you need to configure index patterns. By default, Kibana recommends using the logstash-* index pattern. You can use the default setting or configure additional patterns as needed.
To configure Kibana, use the following steps:
- Log in to the Kibana UI using the URL and credentials provided in Access the Rackspace KaaS dashboards.
- Go to DevTools > Console.
- List available indices by running the following command:
GET _cat/indices
Alternatively, you can run the following cURL command:
curl -XGET "http://<path-to-Kibana-UI>_cat/indices"
Example of system response:
green open .monitoring-es-6-2018.06.21     woJ90oNBTY2IdrN8edLh2w 1 1 182422 648 344.5mb 172.2mb
green open .monitoring-es-6-2018.06.22     Br6Ioc8PRKu1ySQAt-d-cA 1 1 121440 432   229mb 114.8mb
green open .watcher-history-3-2018.06.20   sopRUohGTIWtPRGKf-VGEA 1 1   5760   0   9.6mb   4.8mb
green open .monitoring-kibana-6-2018.06.22 FE6508QfTyWDgc-WoQr\_bg 1 1   5737   0   4.5mb   2.2mb
green open .triggered\_watches              eca1efrIQN2E1XLiujeXEw 1 1      0   0   4.9mb   3.3mb
green open .kibana                         eKGb8L2XRvCoOcUWBsDA1A 1 1      3   0    90kb    45kb
green open .monitoring-es-6-2018.06.20     wH20lwaHT2ikRlwTCS1J\_Q 1 1 182573 594 339.9mb   170mb
green open logstash-2018.06.20             iuaiT6abSsmYSFTN7laLoA 5 1 188593   0 264.8mb 132.4mb
green open .watches                        V1r07Q0wQ1WpHAsPsyNm3Q 1 1      4   0  30.7kb  19.3kb
green open logstash-2018.06.22             O9me9g3BSE6H-0jtKU5oYA 5 1 121590   0 162.1mb    81mb
green open .monitoring-kibana-6-2018.06.20 qZrbShReQka1Eufxb6iQ9A 1 1   8630   0   6.9mb   3.4mb
green open logstash-2018.06.21             jsk2AKCPRfSwkFgg3\_TGkQ 5 1 181909   0 251.4mb 125.8mb
green open .monitoring-kibana-6-2018.06.21 Se2Qfs8WQtGTXlAzMd5Q-A 1 1   8632   0   6.7mb   3.3mb
green open .watcher-history-3-2018.06.22   ENhLUYkmRlOpxOx2HavA6w 1 1   3828   0   6.3mb   3.1mb
green open .watcher-history-3-2018.06.21   GQZ2-GvaSIq\_dA7VTidHdA 1 1   5760   0   9.5mb   4.7mb
-
Click Management > Index Pattern > Create Index Pattern.
-
Configure the default
logstashpattern or a custom pattern as needed. -
Click Create.
-
In the left navigation panel, click Discover to view the logs.
Example:
Monitoring
Logs provide valuable information, but it is incomplete without monitoring data. The Prometheus® and Grafana® bundle serve as the base for the Rackspace KaaS monitoring solution. Prometheus is a robust monitoring and alerting tool for distributed systems that helps cloud administrators to watch the health of both Kubernetes nodes and the workloads that run on the Kubernetes cluster. Data visualization powered by Grafana provides insights into the cluster health through a web-based graphical user interface.
Rackspace KaaS deploys a single instance of Prometheus in each Kubernetes cluster. This single instance of Prometheus monitors the Kubernetes cluster and can be used by both Rackspace operators and customers for monitoring resources across all namespaces.
Because Prometheus primarily focuses on operational monitoring, Rackspace KaaS stores only the recent Prometheus log history. For optimal storage use, Rackspace KaaS sets the default retention period for Prometheus logs and data to three days. However, if you need to store Prometheus data for longer, you can adjust the retention policy by contacting your Rackspace representative or submitting a support ticket.
Documentation links
Use the following links to learn more:
Implementation details
There are currently no specific implementation details for the Rackspace KaaS ServiceMesh service.
Specific usage instructions
For an example of how to use Grafana, see Use Grafana.
For an example of how to use Prometheus, see Example: Deploy a MySQL database with Prometheus monitoring.
For an example of using Prometheus and Grafana, see Configure application metrics monitoring.
Use Grafana
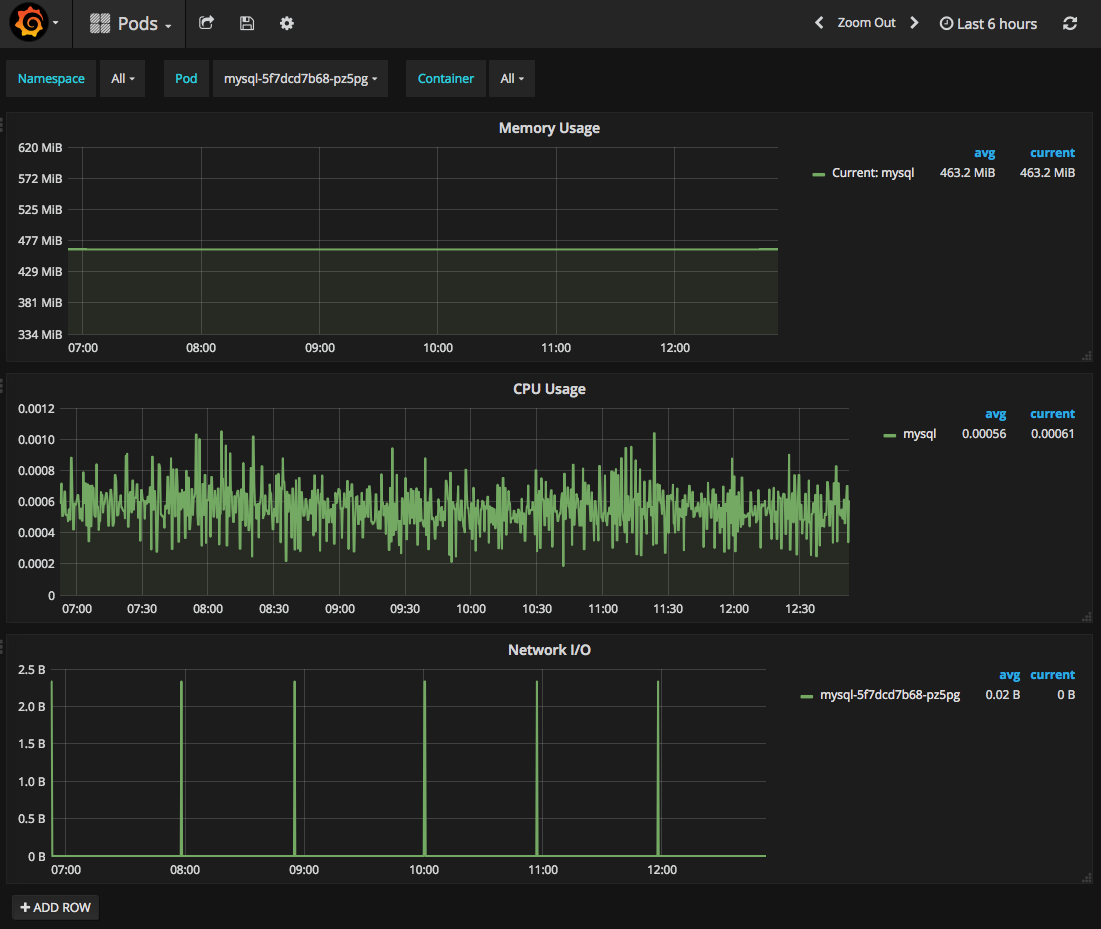
Rackspace KaaS provides preconfigured dashboards for the cluster resource monitoring including resource utilization analytics for pods, deployments, Kubernetes nodes, and etcd nodes. It also provides other useful information that might help you with capacity planning for your clusters.
When you create a new pod in your Kubernetes cluster, Grafana automatically adds it to the preconfigured Pod Dashboard, where you can monitor pod resource utilization. If you need to set up additional metrics to track the health of your Kubernetes applications, you can create or import custom Grafana dashboards.
To use Grafana, complete the following steps:
-
Log in to the Grafana UI by using the URL and credentials provided in Access the Rackspace KaaS dashboards.
-
Click Home.
-
Select a dashboard to display. For example, choose Pods and select a namespace and pod to display, as shown in the following image:
Use Prometheus
Your Rackspace KaaS environment comes with a single instance of Prometheus. Rackspace KaaS preconfigures this instance to monitor the Kubernetes cluster and all resources generated within the cluster. This includes all service metrics and kube metrics. It will also monitor any customer generated resources that have either a service monitor configured or a metrics exporter.
If your organization already has a monitoring solution that you want to use to monitor your Kubernetes applications, contact your Rackspace representative to discuss implementation details.
At a high level, Prometheus sends an HTTPS request to the exporter. The exporter interrogates the application and provides metrics in the Prometheus format to its endpoint conforming to the Prometheus HTTP API.
Because each application is different, no solution fits all use cases. Therefore, you need to define individual configuration files and select appropriate exporters for each application.
Typically, deploying an application with Prometheus monitoring involves the following steps:
- Create a deployment and service configuration file for your application.
- Expose an application-specific Prometheus exporter endpoint.
- Create a service monitor in Kubernetes that defines how Prometheus polls the exporter for data.
- Configure Grafana notifications and dashboards.
Example: Deploy a MySQL database with Prometheus monitoring
As an example, deploy a MySQL database with Prometheus monitoring. You can use the MySQL Prometheus exporter called mysqld_exporter to expose MySQL metrics to Prometheus.
For this example, you need to create the following items:
- A MySQL deployment
- A MySQL service
- A PersistentVolumeClaim for the MySQL database.
- A MySQL exporter deployment
- A MySQL exporter service
- A MySQL exporter service monitor
apiVersion: apps/v1 # for versions before 1.9.0 use apps/v1beta2
kind: Deployment
metadata:
  name: mysql
  labels:
    name: mysql
spec:
  replicas: 1
  selector:
    matchLabels:
      name: mysql
  strategy:
    type: Recreate
  template:
    metadata:
      labels:
        name: mysql
        app: mysql
    spec:
      containers:
      - image: mysql:5.6
        name: mysql
        env:
        - name: MYSQL_ROOT_PASSWORD
          value: password
        ports:
        - containerPort: 3306
          name: mysql
        volumeMounts:
        - name: mysql-persistent-storage
          mountPath: /var/lib/mysql
      volumes:
      - name: mysql-persistent-storage
        persistentVolumeClaim:
          claimName: mysql-pv-claim
---
kind: PersistentVolumeClaim
apiVersion: v1
metadata:
  name: mysql-pv-claim
  labels:
    app: mysql
spec:
  accessModes:
     - ReadWriteOnce
  resources:
    requests:
      storage: 200Gi
---
apiVersion: v1
kind: Service
metadata:
  name: mysql
  labels:
    app: mysql
spec:
  type: ClusterIP
  ports:
    - port: 3306
  selector:
    app: mysql
The following text is the MySQL exporter configuration file (mysqld.yaml):
apiVersion: v1
kind: Service
metadata:
  name: mysqld-exporter
  labels:
    app: mysqld-exporter
spec:
  type: ClusterIP
  ports:
    - name: http-metrics
      port: 9104
selector:
  app: mysqld-exporter

---
apiVersion: extensions/v1beta1
kind: Deployment
metadata:
  name: mysqld-exporter
  labels:
    app: mysqld-exporter
spec:
  selector:
    matchLabels:
      app: mysqld-exporter
  replicas: 1
  template:
    metadata:
      annotations:
        prometheus.io/scrape: "true"
        prometheus.io/port: "9104"
      labels:
        app: mysqld-exporter
    spec:
      containers:
      - name: mysqld-exporter
        image: prom/mysqld-exporter
        env:
        - name: DATA_SOURCE_NAME
          value: root:password@(mysql:3306)/
        ports:
        - containerPort: 9104
---
apiVersion: monitoring.coreos.com/v1
kind: ServiceMonitor
metadata:
  name: mysqld-exporter
spec:
  jobLabel: k8s-app
  selector:
    matchLabels:
      app: mysqld-exporter
  namespaceSelector:
    matchNames:
    - my-test-namespace
  endpoints:
  - port: http-metrics
    interval: 30s
To deploy the MySQL database with Prometheus monitoring, complete the following steps:
- Deploy the MySQL database by using the mysql.yaml file from the preceding example:
kubectl apply -f deployments/stable/mysql.yaml
System response:
deployment "mysql" created
persistentvolumeclaim "mysql-pv-claim" created
service "mysql" created
- Deploy the MySQL exporter by using the mysqld.yaml file from the preceding example:
kubectl apply -f deployments/stable/mysqld.yaml
System response:
service "mysqld-exporter" created
deployment "mysqld-exporter" created
servicemonitor "mysqld-exporter" created
- Verify that the deployment was created by running the following command:
kubectl get deployment,service,pvc -l app=mysql
Example of system response:
NAME      DESIRED   CURRENT   UP-TO-DATE   AVAILABLE   AGE
mysql     1         1         1            1           20s

NAME        TYPE        CLUSTER-IP   EXTERNAL-IP   PORT(S)    AGE
svc/mysql   ClusterIP   10.3.33.6    <none>        3306/TCP   20s

NAME                 STATUS    VOLUME                                     CAPACITY   ACCESS MODES   STORAGECLASS   AGE
pvc/mysql-pv-claim   Bound     pvc-4d2fed9f-ce3d-11e8-a58f-fa163ea62d3e   200Gi      RWO            openstack      20s
- Deploy the MySQL exporter by running the following command:
kubectl apply -f mysqld.yaml
Example of system response:
service "mysqld-exporter" created
deployment "mysqld-exporter" created
servicemonitor "mysqld-exporter" created
- Verify that the deployment and service were created by running the following command:
kubectl get deployment,service -l app=mysqld-exporter
Example of system response:
NAME      DESIRED   CURRENT   UP-TO-DATE   AVAILABLE   AGE
mysql     1         1         1            1           2m

NAME              TYPE        CLUSTER-IP     EXTERNAL-IP   PORT(S)    AGE
mysqld-exporter   ClusterIP   10.3.163.206   <none>        9104/TCP   2m
- Verify that the service monitor was created by running the following command:
kubectl get servicemonitor mysqld-exporter -n monitoring
Example of system response:
NAME              AGE
mysqld-exporter   2m
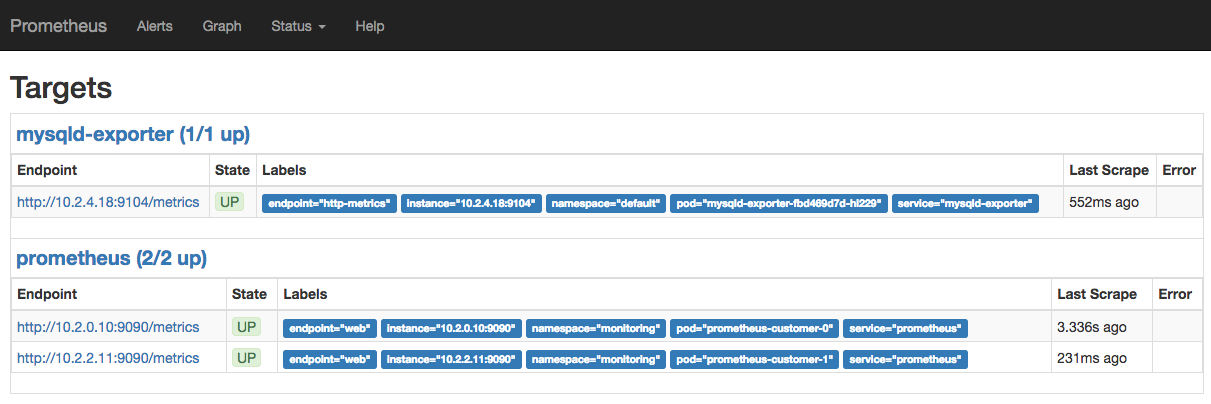
- Log in to the Prometheus UI.
- Go to Status > Targets.
The mysql exporter must be present in the list of endpoints:
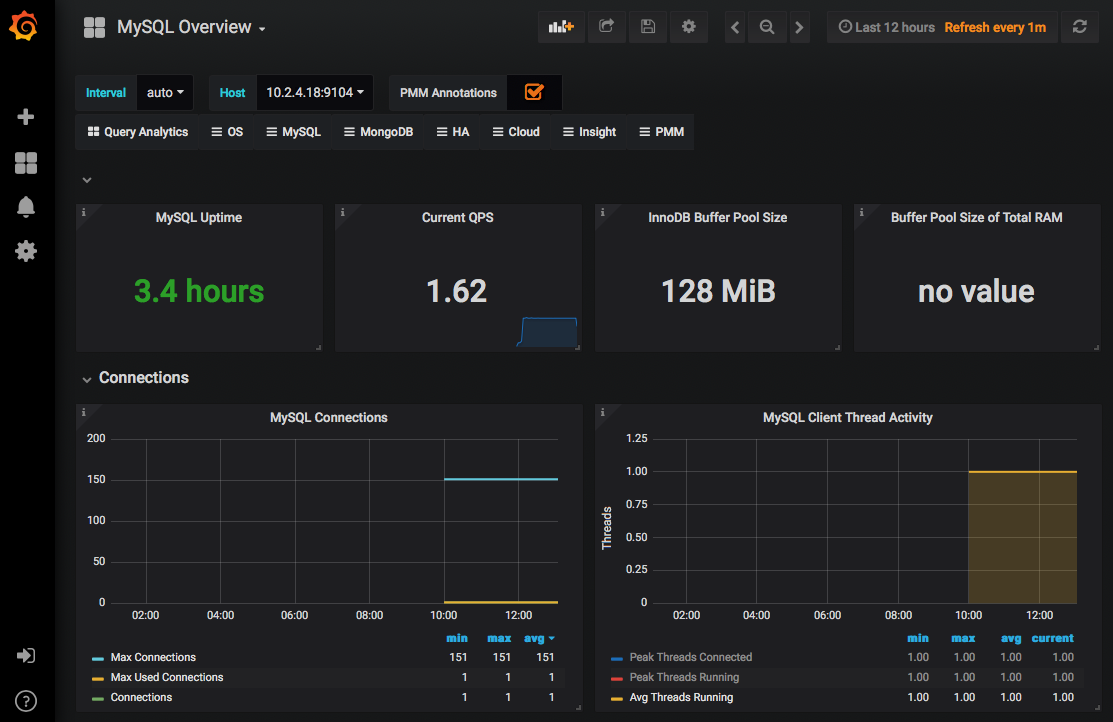
- Go to the Grafana dashboard.
- Import or create a dashboard to monitor your MySQL database.
- In the prometheus field, select
prometheus-monitoringas a source. The following screenshot shows a sample MySQL Overview Grafana dashboard:
- Configure Grafana’s notifications for your communication channel as described in the Grafana documentation
Troubleshooting Prometheus
If you cannot see the mysql-exporter endpoint in the Prometheus UI, follow these troubleshooting guidelines:
- Verify that the deployments, services, service monitor, and the PVC were created successfully:
kubectl get deployment,service,pvc -l app=mysql
Example of system response:
NAME        TYPE        CLUSTER-IP   EXTERNAL-IP   PORT(S)    AGE
svc/mysql   ClusterIP   10.3.33.6    <none>        3306/TCP   1h

NAME                 STATUS    VOLUME                                     CAPACITY   ACCESS MODES   STORAGECLASS   AGE
pvc/mysql-pv-claim   Bound     pvc-4d2fed9f-ce3d-11e8-a58f-fa163ea62d3e   200Gi      RWO            openstack      1h
- Verify that the MySQL exporter’s service and deployment were created:
kubectl get deployment,service -l app=mysqld-exporter
Example of system response:
NAME                     DESIRED   CURRENT   UP-TO-DATE   AVAILABLE   AGE
deploy/mysqld-exporter   1         1         1            1           1h

NAME                  TYPE        CLUSTER-IP     EXTERNAL-IP   PORT(S)    AGE
svc/mysqld-exporter   ClusterIP   10.3.228.251   <none>        9104/TCP   1h
- Verify that the MySQL service monitor was created:
kubectl get servicemonitor -l monitor-app=mysqld-exporter -n monitoring
Example of system response:
NAME              AGE
mysqld-exporter   51m
- Check your .yaml files:
- Verify that you used the
monitor-applabel for the service monitor and that the service monitor is deployed in the monitoring namespace.
- Check the
mysql-exporterlog files for any error:
kubectl logs deployment/mysqld-exporter
Example of system response:
time="2018-10-12T16:39:22Z" level=info msg="Starting mysqld_exporter (version=0.11.0, branch=HEAD, revision=5d7179615695a61ecc3b5bf90a2a7c76a9592cdd)" source="mysqld_exporter.go:206"
time="2018-10-12T16:39:22Z" level=info msg="Build context (go=go1.10.3, user=root@3d3ff666b0e4, date=20180629-15:00:35)" source="mysqld_exporter.go:207"
time="2018-10-12T16:39:22Z" level=info msg="Enabled scrapers:" source="mysqld_exporter.go:218"
time="2018-10-12T16:39:22Z" level=info msg=" --collect.global_variables" source="mysqld_exporter.go:222"
time="2018-10-12T16:39:22Z" level=info msg=" --collect.slave_status" source="mysqld_exporter.go:222"
time="2018-10-12T16:39:22Z" level=info msg=" --collect.info_schema.tables" source="mysqld_exporter.go:222"
time="2018-10-12T16:39:22Z" level=info msg=" --collect.global_status" source="mysqld_exporter.go:222"
time="2018-10-12T16:39:22Z" level=info msg="Listening on :9104" source="mysqld_exporter.go:232"
Dashboard
If you are using RPC) or RPCR, you can access the Kubernetes Dashboard through a web browser to get an overview of your custers, add and update resources, and troubleshoot any issues. It is not currently available for EKS.
The Dashboard lets you perform the following activities:
- View detailed metrics for a node, including its specification, status, and the pods running on the node.
- View the applications running in a specific namespace in summary or detailed views.
- View resource that allow you to expose services externally.
- View Persistent Volume Claim resources used by applications.
- View logs of pods, including detailed pages.
Documentation links
Use the following link to learn more:
Implementation details
There are currently no specific implementation details for the Rackspace KaaS Kubernetes Dashboard service.
Specific usage instructions
To access the Kubernetes Dashboard, browse the following URL, substituting your cluster-name and dns-zone:
Kubernetes Web UI https://<cluster-name>.<dns-zone>/dashboard
When prompted, enter your Identity Provider credentials.
For more information on authentication, see :ref:td-integrated-authentication`.
ServiceMesh
A service mesh controls how different parts of an application share data with one another. Rackspace KaaS uses Istio, an opensource service mesh that is built into the application infrastructure, to manage communications between microservices and applications.
Documentation links
Use the following link to learn more:
Implementation details
There are currently no specific implementation details for the Rackspace KaaS ServiceMesh service.
Specific usage instructions
There are currently no specific usage instructions for the Rackspace KaaS ServiceMesh service.
Using Rackspace KaaS
To use Rackspace KaaS to deploy and manage your Kubernetes applications,review this section to learn how to configure your environment and go over some basic operations.
Configure your environment
To use Rackspace KaaS, review the following sections:
- Requirements
- Resource limits
- Access your Kubernetes cluster with kubectl
- Configure application metrics monitoring
- Access the Rackspace KaaS dashboards
- Access deployment URLs
- Internal Deployment Repository
Requirements
Rackspace KaaS enables you to run Kubernetes workloads on top of an Amazon EKS or a Rackspace Private Cloud Powered by OpenStack or Red Hat. Rackspace deployment engineers deploy all the underlying infrastructure for you. If you require a local image repository due to external internet limitations, please see the following section before continuing: :ref: uk-ec-internal-deployment-repository
Before you begin using Rackspace KaaS, you must have the following items on your client machine:
- kubectl: An official Kubernetes command-line client. All the examples in this guide use
kubectl. - Docker Community Edition: Required to execute examples described in this guide.
Resource limits
Rackspace KaaS custom builds clusters to the customer’s specifications.
The minimum Kubernetes cluster configuration, with three worker nodes, includes the following elements:
Kubernetes worker nodes:
- vCPU: 4
- RAM: 8 GB
- Local storage: 40 GB of local storage
Private Docker registry:
- Database: 10 GB
Note
The private Docker registry database stores metadata for Docker images. Rackspace KaaS stores the actual Docker images in an object storage system, such as Ceph™ RADOS Gateway (RGW), OpenStack Swift, AWS S3, or another compatible object store that you deploy as part of your cloud.
If you need to resize your cluster, contact your Rackspace representative and request additional resources.
Access your Kubernetes cluster with kubectl
To access your Kubernetes cluster, log in to the Kubernetes Access Manager(KAM) with your identity credentials, and get a kubeconfig file to use with kubectl commands. Complete the following steps to access your cluster with kubectl:
- Access KAM.
- Enter your Identity Provider credentials.
- Select the group to use when getting credentials.
- Save the kubeconfig file locally.
- If you are using EKS, add the AWS credentials.
- Configure
kubectlto use your newly created kubeconfig file.
See the list of Rackspace KaaS dashboards at Access the Rackspace KaaS dashboards.
To use KAM to get your credentials and configure a kubeconfig file, see Access KAM and Authentication.
Configure application metrics monitoring
Rackspace KaaS provides an easy to use and configure Prometheus cloud monitoring solution that visualizes alerts and metrics through Grafana dashboards. You can configure Prometheus to collect metrics from your Kubernetes applications through a Kubernetes Custom Resource Definition (CRD) called a ServiceMonitor. You can define the ServiceMonitor in a simple yaml file and apply this file to your configuration by using kubectl. Then, configure a Grafana alert notification channel of choice as described in the Grafana documentation. Rackspace KaaS supports the following Grafana notifications types:
- Slack
- PagerDuty
- Webhook
To configure application metrics monitoring, complete the following steps:
- Create a yaml configuration file similar to the following example:
apiVersion: monitoring.coreos.com/v1alpha1
kind: ServiceMonitor
metadata:
  name: your-application
  namespace: rackspace-monitoring
  labels:
  monitor: rackspace-prometheus # This label enables the
  managed prometheus resource can detect the service.
spec:
  selector:
    matchLabels:
      some-label: <that-will-match-your-application-service>
  namespaceSelector:
    matchNames:
    - the-namespace-where-your-application-lives # needs to be the namespace
      the app got deployed to
  endpoints:
    - port: the-name-of-the-port-that-exposes-your-metrics-endpoint
- Save the file as service-monitor.yaml.
- Apply the following configuration:
$ kubectl apply -f service-monitor.yaml
- Configure Grafana alert notifications for your application as described in the Grafana documentation.
For more information about using Prometheus and Grafana with Rackspace KaaS, see Monitoring.
Access the Rackspace KaaS dashboards
Rackspace KaaS enables you to access the managed services user interface by using your web browser. KAM provides authentication for all of the dashboards. For more informations, see Integrated Authentication.
To access the dashboards, you need the following information:
- Your Kubernetes cluster name
- Your Kubernetes cluster domain name
- Your Identity Provider username or email and password
For example, if your cluster name is test and the domain name is mk8s.systems, the URL to access the Kubernetes UI would be https://kam.test.mk8s.systems.
The following table lists the customer-facing dashboards.
| Managed service | URL |
|---|---|
| KAM | https://kam.<cluster-name>.<domain-name>/graph |
| Prometheus Monitoring | https://prometheus.<cluster-name>.<domain-name>/graph |
| Grafana Dashboard | https://grafana.<cluster-name>.<domain-name> |
| Logging | https://kibana.<cluster-name>.<domain-name> |
| Private registry | https://registry.<cluster-name>.<domain-name> |
Access deployment URLs
During the deployment and lifecycle management of a Kubernetes cluster, Rackspace KaaS might need to access specific websites to acquire software artifacts.
The following table lists the URLs that Kubernetes nodes and virtual machines must be able to access:
| URL | Port | Protocol | Description |
|---|---|---|---|
*.cloudfront.net | 443 | TCP | Amazon CloudFront® data |
console.cloud.google.com | 443 | TCP | Google Cloud Platform |
coreos.com | 443 | TCP | CoreOS data |
docker.io | 443 | TCP | Docker software |
docker.elastic.co | 443 | TCP | Elasticsearch Docker registry |
docker-auth.elastic.co | 443 | TCP | Elasticsearch Docker registry authentication |
git.alpinelinux.com | 443 | TCP | Alpine Linux Security database |
github.com | 443 | TCP | Alpine Linux Security database |
gcr.io | 443 | TCP | Google container registry |
hub.docker.com | 443 | TCP | Docker Hub registry |
k8s.gcr.io | 443 | TCP | Kubernetes Google Cloud registry |
launchpad.net/ubuntu-cve-tracker | 443 | TCP | Ubuntu operating system data |
linux.oracle.com | 443 | TCP | Oracle® Linux security feed |
monitoring.api.rackspacecloud.com | 443 | TCP | Rackspace monitoring API |
public.update.core-os.net | 443 | TCP | CoreOS updates |
quay.io | 443 | TCP | Quay.io registry |
quay-registry.s3.amazonaws.com | 443 | TCP | Quay.io registry |
www.redhat.com | 443 | TCP | Red Hat Enterprise Linux security feed |
http://registry-1.docker.io | 443 | TCP | Docker registry data |
replicate.npmjs.com | 443 | TCP | NPM Registry package data |
salsa.debian.org | 443 | TCP | Debian security feed |
s3-us-west-2.amazonaws.com | 443 | TCP | Ruby gems data feed (stored in Amazon S3) |
security-tracker.debian.org | 443 | TCP | Debian security feed |
stable.packages.cloudmonitoring.rackspace.com | 443 | TCP | Rackspace cloud monitoring packages |
static.nvd.nist.gov | 443 | TCP | NVD database |
storage.googleapis.com | 443 | TCP | Google Cloud Storage API data |
update.release.core-os.net | 443 | TCP | CoreOS updates |
List of URLs for deployment
For more information, see the following documents:
Internal Deployment Repository
If your environment is configured to use internal image repositories you will need to create the repositories for the following containers:
Platform security
This section describes the security built into Rackspace KaaS.
Contents
Security limitations
By default, Rackspace KaaS security features enforce a set of limitations for deployments, ReplicationControllers, and pods.
The containers cannot perform the following actions:
- Run as root
- Run as privileged
- Use host networking
- Use root namespaces
See Configure pod security policies for workarounds for all of the preceding limitations.
Configure network policies
Kubernetes clusters use the NetworkPolicy resource to control network access between pods.
Example of a restrictive network policy
The following code snippet creates a NetworkPolicy for the foo-dev namespace that prevents all ingress and egress traffic. Because it blocks all communication to and from the namespace, this NetworkPolicy provides the most secure and most restrictive configuration. You can use the following example as a base layer in new namespaces and then add new policies for specific pods to selectively whitelist the network traffic.
$ kubectl create -f- <<EOF
  apiVersion: networking.k8s.io/v1
  kind: NetworkPolicy
  metadata:
    namespace: foo-dev
    name: default-deny
  spec:
    podSelector: {}
    policyTypes:
    - Ingress
    - Egress
  EOF
For more information, see the Kubernetes NetworkPolicy documentation.
Configure pod security policies
Kubernetes clusters use PodSecurityPolicy objects to enforce security and policy controls on pod creation and updates.
PodSecurityPolicy enables Kubernetes cluster admins to configure granular access to cluster resources and privileges for each pod. By default, Rackspace KaaS includes the following predefined Pod Security Policies (PSP):
privileged- provides a broad set of privileges that are used by cluster admins.restricted- provides a limited set of privileges for cluster tenants, such as users and namespaces.
To ensure that users with the edit or admin (not cluster-admin) roles use the restricted PodSecurityPolicy, Rackspace KaaS predefines the following ClusterRole:
kind: ClusterRole
apiVersion: rbac.authorization.k8s.io/v1
metadata:
  name: restricted-psp
  # Aggregate to admin/edit roles so that admins don't always have to bind users
  # to custom role.
  labels:
    rbac.authorization.k8s.io/aggregate-to-admin: "true"
    rbac.authorization.k8s.io/aggregate-to-edit: "true"
rules:
- apiGroups:    ["extensions"]
  resources:     ["podsecuritypolicies"]
  verbs:         ["use"]
  resourceNames: ["restricted"]
To grant non-cluster-admin users broader permissions, configure additional PSPs, make them usable by assigning a Role, and bind them to the user through a RoleBinding.
You can configure a PSP by creating a PodSecurityPolicy configuration file and applying it with the kubectl create command.
To configure a PodSecurityPolicy object, perform the following steps:
- Create a new
PodSecurityPolicyconfiguration file. The following text is an example of a restricted policy:
apiVersion: extensions/v1beta1
kind: PodSecurityPolicy
  metadata:
    name: restricted
  spec:
    privileged: false
    # Required to prevent escalations to root.
    allowPrivilegeEscalation: false
    # This is redundant with non-root + disallow privilege escalation,
    # but we can provide it for defense in depth.
    requiredDropCapabilities:
      - ALL
    # Allow core volume types.
    volumes:
      - 'configMap'
      - 'emptyDir'
      - 'projected'
      - 'secret'
      - 'downwardAPI'
      # Assume that persistentVolumes set up by the cluster admin are safe to use.
      - 'persistentVolumeClaim'
    hostNetwork: false
    hostIPC: false
    hostPID: false
    runAsUser:
      # Require the container to run without root privileges.
      rule: 'MustRunAsNonRoot'
    seLinux:
      # This policy assumes the nodes are using AppArmor rather than SELinux.
      rule: 'RunAsAny'
    supplementalGroups:
      rule: 'MustRunAs'
      ranges:
        # Forbid adding the root group.
        - min: 1
          max: 65535
    fsGroup:
      rule: 'MustRunAs'
      ranges:
        # Forbid adding the root group.
        - min: 1
          max: 65535
    readOnlyRootFilesystem: false
- Create a pod and the security policy by running the following command:
kubectl create -f <name-of-security-policy-file>
- Verify that the
PodSecurityPolicyobject was created by running the following command:
kubectl get psp
For more information, see Cluster hardening and the Kubernetes Pod Security Policy documentation.
Kubernetes basics
Your Kubernetes cluster supports basic Kubernetes resources, such as deployments and services. This section provides examples of the following basic operations for an Nginx Kubernetes deployment with the LoadBalancer service:
- Launch a new deployment
- Expose your deployment with a load balancer
- Access your deployment
- Add persistent storage to your deployment
- Use local storage
- Scale replicas for your deployment
- Clean up the deployment
For more information about the Kubernetes objects, see the Kubernetes documentation.
Launch a new deployment
Create a deployment called nginx using the official Nginx image with five replicas.
- Create a deployment:
$ kubectl run nginx --image nginx --replicas 5
  deployment "nginx" created
- Verify by displaying the list of pods:
$ kubectl get pods
  NAME                     READY     STATUS    RESTARTS   AGE
  nginx-2371676037-9ktzl   1/1       Running   0          27s
  nginx-2371676037-kdm13   1/1       Running   0          27s
  nginx-2371676037-l2x0c   1/1       Running   0          27s
  nginx-2371676037-tl21g   1/1       Running   0          27s
  nginx-2371676037-vwpr0   1/1       Running   0          27s

$ kubectl get deployments nginx
$ kubectl describe deployments nginx
Expose your deployment with a load balancer
Expose the Nginx deployment by using the Kubernetes LoadBalancer service.
- Create a LoadBalancer service object by running the following command:
$ kubectl expose deployment/nginx --port=80 --type=LoadBalancer
  service "nginx" exposed
Kubernetes creates a load balancer that directs all traffic on port 80 to one of the five Nginx replicas.
- Verify that the service is created by running the following command:
$ kubectl get service nginx
  NAME         CLUSTER-IP    EXTERNAL-IP   PORT(S)        AGE
  nginx        10.3.108.11   148.62.x.x    80:32350/TCP   49s
Access your deployment
To access your deployment, use the EXTERNAL-IP from the preceding Nginx service in a web browser or use the following cURL command with your EXTERNAL-IP and port:
$ curl http://<external-ip>:<port>
Add persistent storage to your deployment
Rackspace KaaS enables you to add persistent storage to your pods so that you can run stateful applications. You can add a PersistentVolume by using a StorageClass and mounting the volume to a storage server, or by creating a hostPath PersistentVolume and mounting it to your Kubernetes master node storage. We support the latter, but because Kubernetes cannot remount the data volume and recover from node failures that might trigger application outages, we do not recommend that you create a hostPath PersistentVolume. However, if you use distributed, replicated, or ephemeral systems, such as Kafka or Redis, you might be able to use host local storage because the data is replicated within these systems and does not require Kubernetes to remount or recover the failed nodes. In other cases,use the default StorageClass for the OpenStack Block Storage service (cinder), which is backed by Ceph.
To add a persistent volume to a pod, you need to create a PersistentVolumeClaim (PVC). Because your Kubernetes cluster already has a default StorageClass, which is used by default, you do not need to specify it in the PVC.
Rackspace KaaS supports the following access modes to persistent volumes:
- ReadWriteOnce (RWO): You can mount a volume with read and write access to a single node.
- ReadOnlyMany (ROM): You can mount a volume with read-only permissions to many nodes.
Note
Racksapce KaaS does not support automated volume expansion by using the allowVolumeExpansion parameter or PersistentVolumeClaimResize.
Add persistent storage example
To add persistent storage to your cluster, use the following steps:
- Create a configuration file for the PVC with the following code:
kind: PersistentVolumeClaim
apiVersion: v1
metadata:
  name: pvc-test
spec:
  accessModes:
    - ReadWriteOnce
  resources:
    requests:
      storage: 32Gi
Note
You cannot specify a volumeName in the PVC. Instead, Rackspace KaaS assigns a name to the PersistentVolume (PV).
- Create the PersistentVolumeClaim by running the following command:
kubectl create -f deployments/stable/storage/pvc-test1.yaml
- Verify that the claim was created by displaying the list of PVCs in the cluster by running the following command:
kubectl get pvc
Example of system response:
NAME        STATUS    VOLUME                                     CAPACITY   ACCESS MODES   STORAGECLASS   AGE
pvc-test    Bound     pvc-02a20856-6f39-11e8-b07f-fa163e9c3664   32Gi       RWO            openstack      3
The status must be Bound. If you see the status set to Pending, your configuration file might be incorrect.
- Open an existing pod file for editing or create a deployment configuration file for your stateful application with the following code:
Example:
apiVersion: apps/v1
kind: Deployment
metadata:
  name: mysql
spec:
  selector:
    matchLabels:
      app: mysql
  strategy:
    type: Recreate
  template:
    metadata:
      labels:
        app: mysql
    spec:
      containers:
      - image: mysql:5.6
        name: mysql
        env:
          # Use secret in real usage
        - name: MYSQL_ROOT_PASSWORD
          value: password
        ports:
        - containerPort: 3306
          name: mysql
        volumeMounts:
        - name: mysql-persistent-storage
          mountPath: /var/lib/mysql
      volumes:
      - name: mysql-persistent-storage
        persistentVolumeClaim:
          claimName: pvc-test
- Verify that
claimNameis set to the claim that you created in previous steps. - Create the pod or apply the changes to the existing pod by running one of the following commands:
kubectl apply -f deployments/mysql-test.yaml
System response:
deployment "mysql" created
- Verify that the MySQL pod was created by running the following command:
kubectl get pods
Example of system response:
NAME                     READY     STATUS              RESTARTS   AGE
mysql-5f7dcd7b68-2rfx2   1/1       Running             0          1m
- Verify that the deployment uses the created persistent volume by running the following command:
kubectl describe pod mysql-5f7dcd7b68-m97s9
Example of system response:
Name:           mysql-5f7dcd7b68-m97s9
Namespace:      default
Node:           kubernetes-test-worker-1/10.0.0.13
Start Time:     Wed, 13 Jun 2018 13:59:18 -0700
Labels:         app=mysql
             pod-template-hash=1938783624
Annotations:    <none>
Status:         Running
IP:             10.2.0.44
Controlled By:  ReplicaSet/mysql-5f7dcd7b68
Containers:
mysql:
 Container ID:   docker://4e22406c32cb2004ec32ffef1f2ca82630d4028027a21324460317afb440f857
 Image:          mysql:5.6
 Image ID:       docker-pullable://mysql@sha256:7e3575b7949a4f8712a47b0fc875022dcea5d84f4672b1532587b6933502f757
 Port:           3306/TCP
 State:          Running
   Started:      Wed, 13 Jun 2018 13:59:33 -0700
 Ready:          True
 Restart Count:  0
 Environment:
   MYSQL_ROOT_PASSWORD:  password
 Mounts:
   /var/lib/mysql from mysql-persistent-storage (rw)
   /var/run/secrets/kubernetes.io/serviceaccount from default-token-szjzp (ro)
Conditions:
Type           Status
Initialized    True
Ready          True
PodScheduled   True
Volumes:
mysql-persistent-storage:
 Type:       PersistentVolumeClaim (a reference to a PersistentVolumeClaim in the same namespace)
 ClaimName:  pvc-test1
 ReadOnly:   false
default-token-szjzp:
 Type:        Secret (a volume populated by a Secret)
 SecretName:  default-token-szjzp
 Optional:    false

 ...
Use local storage
While Kubernetes supports adding a persistent volume that uses storage space from a Kubernetes node, we do not recommend that you use such volumes in production environments. Instead, create a PersistentVolumeClaim by using the default StorageClass as described in Add persistent storage to your deployment. If you still decide to use storage on a Kubernetes worker node by creating a hostPath volume, you must verify that the node has sufficient disk space. You cannot resize this volume.
To verify storage space that is used by a pod on a Kubernetes node, run the following commands:
- Get the location of the storage by obtaining the information about the pod mount point:
kubectl describe pod <pod-name>
Example of system response:
...

Mounts:
  /usr/share/nginx/html from pv-volume (rw)

...
- Get the information about available disk space:
kubectl exec -it <pod-name> -- /bin/bash -c 'df /usr/share/nginx/html'
Example of system response:
Filesystem     1K-blocks    Used Available Use% Mounted on
/dev/vda9       99171716 9720480  85276368  11% /usr/share/nginx/html
- Create a hostPath persistent volume as described in the Kubernetes documentation.
Scale replicas for your deployment
You can scale your Nginx deployment by increasing the number of replicas in the deployment by use the following steps:
- Increase the number of replicas by running the following command:
$ kubectl scale deployment/nginx --replicas=10
  deployment "nginx" scaled
- View the status of the deployment update by running the following command:
$ kubectl rollout status deployment/nginx
System response:
deployment "nginx" successfully rolled out
- Verify by displaying the list of pods by running the following command:
$ kubectl get pods
  NAME                     READY     STATUS    RESTARTS   AGE
  nginx-2371676037-9ktzl   1/1       Running   0          11m
  nginx-2371676037-k22cm   1/1       Running   0          2m
  nginx-2371676037-kdm13   1/1       Running   0          11m
  nginx-2371676037-l2x0c   1/1       Running   0          11m
  nginx-2371676037-qzqh9   1/1       Running   0          2m
  nginx-2371676037-tl21g   1/1       Running   0          11m
  nginx-2371676037-tvkgz   1/1       Running   0          2m
  nginx-2371676037-vwpr0   1/1       Running   0          11m
  nginx-2371676037-ww7f7   1/1       Running   0          2m
  nginx-2371676037-xjkq9   1/1       Running   0          2m
Clean up the deployment
When you finish this Nginx example, you can delete the deployment and service objects by running the following commands:
$ kubectl delete service nginx
$ kubectl delete deployment nginx
Document history and additional information
This release replaces and obsoletes all earlier releases. The most recent releases are listed in the following table:
| Revision Date | Release information |
|---|---|
| 2020-03-06 | Rackspace Kubernetes-as-a-Service 3.0.0 GA |
| 2019-04-24 | Rackspace Kubernetes-as-a-Service 2.1.0 GA |
| 2019-02-13 | Rackspace Kubernetes-as-a-Service 2.0.0 GA |
| 2018-12-17 | Rackspace Kubernetes-as-a-Service 1.5.0 GA |
| 2018-10-01 | Rackspace Kubernetes-as-a-Service 1.4.0 GA |
| 2018-09-01 | Rackspace Kubernetes-as-a-Service 1.3.0 GA |
| 2018-08-01 | Rackspace Kubernetes-as-a-Service 1.2.0 GA |
| 2018-07-12 | Rackspace Kubernetes-as-a-Service 1.1.1 GA |
| 2018-07-02 | Rackspace Kubernetes-as-a-Service 1.1.0 GA |
| 2018-05-31 | Rackspace Kubernetes-as-a-Service 1.0.x GA |
Disclaimer
THE INFORMATION CONTAINED IN THE RACKSPACE DEVELOPER DOCUMENTATION IS FOR INFORMATIONAL PURPOSES ONLY AND IS PROVIDED “AS IS.”
Except as set forth in Rackspace general terms and conditions, and other Rackspace agreement(s) you may sign, Rackspace assumes no liability whatsoever, and disclaims any express or implied warranty, relating to its services including, but not limited to, the implied warranty of merchantability, fitness for a particular purpose, and non-infringement.
Although part of this document explains how Rackspace services may work with third-party products, the information contained in the document is in no way a guarantee of support or compatibility. Any use or changes to third-party products or configurations should be made at the discretion of your administrators and subject to the applicable third-party terms and conditions. Except as otherwise specified in your signed Rackspace agreement(s), Rackspace does not provide technical support for third-party products and accepts no responsibility for third-party products.
Except as expressly provided in any written license agreement from Rackspace, the furnishing of this document does not give you any license to patents, trademarks, copyrights, or other intellectual property. Rackspace®, Fanatical Support®, Fanatical Experience™, and other Rackspace marks are either registered service marks or service marks of Rackspace US, Inc. in the United States and other countries.
All other third-party product names and trademarks used in this document do not imply endorsement or sponsorship of Rackspace by those third-parties and are used solely for identification purposes and are property of their respective owners.
Rackspace cannot guarantee the accuracy of any information presented after the date of publication.
Updated 5 months ago