KaaS Support
Rackspace Kubernetes-as-a-Service
Last updated: Feb 11, 2022
Release: v6.0.2
This section is a quick reference for Rackspace support engineers who have questions about Rackspace Kubernetes-as-a-Service (KaaS). The section includes the information about monitoring, troubleshooting, and upgrading a Rackspace KaaS cluster.
- Preface
- Getting started with Kubernetes
- Common customer support operations
- Network configuration
- Add resource limits to applications
- Troubleshooting
- Kubernetes tips, tricks, and one-liners
- Rackspace Kubernetes-as-a-Service architecture
- Upgrade Rackspace KaaS
- Recover from a stack update
- Use a private Docker image registry
- SSL certificates rotation
- Backups and disaster recovery
- Document history and additional information
- Disclaimer
Getting started with Kubernetes
KaaS is based on upstream Kubernetes, and many upstream concepts and operations apply to Kubernetes clusters deployed by KaaS. If you are new to Kubernetes, use these resources to get started:
- Kubernetes basics
- Deploy an application
- Explore your application
- Expose your application publicly
- Scale your application
- Update your application
Common customer support operations
This section includes information about customer support operations for Rackspace Kubernetes-as-a-Service (KaaS).
- Create a monitoring suppresion
- Resize a Kubernetes cluster
- Replace a Kubernetes node
- Replace an etcd node
- Replace a load balancer
- Update the rpc-environments repository
Create a monitoring suppression
Before performing maintenance, create a new suppression for the monitored environments:
- Log in to the Rackspace Business Automation (RBA) portal.
- Go to Event Management -> Suppression Manager 3.0 -> Schedule New Suppression.
- Fill in each of the tabs. Use the correct account, ticket, and device numbers.
- Confirm that the suppression is added to the maintenance ticket.
Resize a Kubernetes cluster
You can resize a Kubernetes cluster by adding or removing Kubernetes worker nodes, etcd nodes, or other nodes.
The kaasctl cluster scale command is under development. For emergency resize operations, use the procedure described in K8S-2052.
Replace a Kubernetes node
If one of the nodes in the Kubernetes cluster fails, you can replace it by using the kaasctl cluster replace-node command.
To repair a failed Kubernetes node, run the following commands:
- If you have not yet done so, start an interactive Docker session as described in Start an interactive Docker session.
- View the list of nodes in your cluster:
kaasctl cluster list-nodes <cluster-name>
Example:
kaasctl cluster list-nodes kubernetes-test

NodeID                                                  ProviderID                           Name                  Type
openstack_compute_instance_v2.etcd.0                    2371c70b-d8e7-44e9-ab9b-6ff3b5d8cc7c kubernetes-test-etcd-1          etcd
openstack_compute_instance_v2.etcd.1                    ed664934-0ae4-4532-83a9-305a2f9e1e7c kubernetes-test-etcd-2          etcd
openstack_compute_instance_v2.etcd.2                    431aa4cc-10d2-46d2-be36-85ebaeb619e3 kubernetes-test-etcd-3          etcd
openstack_compute_instance_v2.k8s_master_no_etcd.0      11b5c173-d5be-4bf4-9a2a-1bebbd9a70f8 kubernetes-test-k8s-master-ne-1 master
openstack_compute_instance_v2.k8s_master_no_etcd.1      6fcaca4a-502d-40b9-bd7f-1e47a98458cb kubernetes-test-k8s-master-ne-2 master
openstack_compute_instance_v2.k8s_master_no_etcd.2      73c4952d-b02a-4493-a188-592f6f56dd2b kubernetes-test-k8s-master-ne-3 master
openstack_compute_instance_v2.k8s_node_no_floating_ip.0 ae106171-4ee1-4e2b-9478-bcdb242b8f01 kubernetes-test-k8s-node-nf-1   worker
openstack_compute_instance_v2.k8s_node_no_floating_ip.1 c9a74608-27f3-4370-a2b6-5531a0b2a288 kubernetes-test-k8s-node-nf-2   worker
openstack_compute_instance_v2.k8s_node_no_floating_ip.2 8473185a-43bf-472e-bc8a-bb93611b889f kubernetes-test-k8s-node-nf-3   worker
openstack_compute_instance_v2.k8s_node_no_floating_ip.3 b0e7ed19-42ee-45ba-b371-1a70bffc4ed5 kubernetes-test-k8s-node-nf-4   worker
- Replace a failed node by using the NodeID from the output of the
kaasctl cluster list-nodescommand:
kaasctl cluster replace-node <cluster-name> <NodeID>
Example:
kaasctl cluster replace-node kubernetes-test openstack_compute_instance_v2.k8s_node_no_floating_ip.0

The resource openstack_compute_instance_v2.k8s_node_no_floating_ip.0 in the module root.compute has been marked as tainted!
Initializing modules...

- module.network
- module.ips
- module.compute
- module.loadbalancer
- module.dns

Initializing provider plugins...
- When prompted, type
yes.
Enter a value:Do you want to perform these actions?
Terraform will perform the actions described above.
Only 'yes' will be accepted to approve.

Enter a value:
This operation might take up to 15 minutes.
Example of system response:
...
Gathering Facts ----------------------------------------------------- 3.33s
fetch admin kubeconfig from Kube master ----------------------------- 2.18s
fetch Kube CA key from Kube master ---------------------------------- 2.09s
fetch Etcd CA cert from Kube master --------------------------------- 2.07s
fetch Etcd client cert from Kube master ----------------------------- 2.05s
fetch Kube CA cert from Kube master ----------------------------------2.05s
fetch Etcd client key from Kube master -------------------------------1.95s
write updated kubeconfig to file -------------------------------------0.82s
download : Sync container --------------------------------------------0.80s
download : Download items --------------------------------------------0.77s
use apiserver lb domain name for server entries in kubeconfig --------0.46s
read in fetched kubeconfig -------------------------------------------0.25s
kubespray-defaults : Configure defaults ------------------------------0.16s
download : include_tasks ---------------------------------------------0.10s
- Exit the interactive Docker session:
exit
- Verify the replaced node operation:
kubectl get nodes -o wide

kubectl get nodes -o wide
NAME                              STATUS                     ROLES     AGE       VERSION   EXTERNAL-IP    OS-IMAGE                                        KERNEL-VERSION   CONTAINER-RUNTIME
kubernetes-test-k8s-master-ne-1   Ready                      master    21h       v1.11.5   146.20.68.57   Container Linux by CoreOS 1855.4.0 (Rhyolite)   4.14.67-coreos   docker://18.6.1
kubernetes-test-k8s-master-ne-2   Ready                      master    21h       v1.11.5   146.20.68.54   Container Linux by CoreOS 1855.4.0 (Rhyolite)   4.14.67-coreos   docker://18.6.1
kubernetes-test-k8s-master-ne-3   Ready                      master    21h       v1.11.5   146.20.68.76   Container Linux by CoreOS 1855.4.0 (Rhyolite)   4.14.67-coreos   docker://18.6.1
kubernetes-test-k8s-node-nf-1     Ready                      node      21h       v1.11.5   <none>         Container Linux by CoreOS 1855.4.0 (Rhyolite)   4.14.67-coreos   docker://18.6.1
kubernetes-test-k8s-node-nf-2     Ready                      node      21h       v1.11.5   <none>         Container Linux by CoreOS 1855.4.0 (Rhyolite)   4.14.67-coreos   docker://18.6.1
kubernetes-test-k8s-node-nf-3     Ready                      node      21h       v1.11.5   <none>         Container Linux by CoreOS 1855.4.0 (Rhyolite)   4.14.67-coreos   docker://18.6.1
kubernetes-test-k8s-node-nf-4     Ready                      node      21h       v1.11.5   <none>         Container Linux by CoreOS 1855.4.0 (Rhyolite)   4.14.67-coreos   docker://18.6.1
NOTE: If you want to replace more than one node, you need to run this command for each node.
Replace a master node
Master node replacement is currently not implemented.
Replace an etcd node
If one of the nodes in the etcd cluster fails, you can mark it as unhealthy by using the Terraform taint command, replace the node, and then rerun the deployment of the unhealthy components. First, identify the node that needs to be replaced and then run the taint command so that Terraform applies the necessary changes to the cluster.
To repair an unhealthy etcd node, run the following commands:
-
If you have not yet done so, start an interactive Docker session as described in Start an interactive Docker session.
-
Change the current directory to the directory with the
terraform.tfstatefile. Typically, it is located in/<provider-dir>/clusters/<cluster-name>. -
Run the
terraform taintcommand:
terraform taint -module='compute' '<etcd-node-name>'
Example for an OpenStack environment:
terraform taint -module='compute' 'openstack_compute_instance_v2.etcd.4'
- Redeploy the infrastructure:
kaasctl cluster create <cluster-name> --infra-only
- Verify the nodes that
kaasctlreplaces in the output and, when prompted, typeyes. - Remove the failed etcd member from the cluster:
i. Connect to the etcd master node by using SSH. Use the id_rsa_core key stored in <provider-dir>/clusters/<cluster-name>.
ii. Change the directory to /etc/kubernetes/ssl/etcd/.
iii. Get the list of endpoints:
ps -ef | grep etcd
iv. Get the status of the endpoints:
ETCDCTL_API=3 etcdctl --endpoints <list-of-endpoints> --cacert="ca.pem" --cert="<cert-name>.pem" --key="<key>.pem" endpoint health
Example:
ETCDCTL_API=3 etcdctl --endpoints https://10.0.0.6:2379,https://10.0.0.13:2379,https://10.0.0.14:2379,https://10.0.0.9:2379,https://10.0.0.7:2379 --cacert="ca.pem" --cert="node-kubernetes-test-k8s-master-ne-1.pem" --key="node-kubernetes-test-k8s-master-ne-1-key.pem" endpoint health
v. Get the list of cluster members:
ETCDCTL_API=3 etcdctl --endpoints <list-of-endpoints> --cacert="ca.pem" --cert="<cert-name>.pem" --key="<key>.pem" member list
Example:
ETCDCTL_API=3 etcdctl --endpoints https://10.0.0.6:2379,https://10.0.0.13:2379,https://10.0.0.14:2379,https://10.0.0.9:2379,https://10.0.0.7:2379 --cacert="ca.pem" --cert="node-kubernetes-test-k8s-master-ne-1.pem" --key="node-kubernetes-test-k8s-master-ne-1-key.pem" member list
Correlate the IP of the unhealthy endpoint above with the correct member.
vi. Remove the unhealthy etc member by using the hash for the correct member:
ETCDCTL_API=3 etcdctl --endpoints <list-of-endpoints> --cacert="ca.pem" --cert="<cert-name>.pem" --key="<key>.pem" member remove <hash>
Example:
ETCDCTL_API=3 etcdctl --endpoints https://10.0.0.6:2379,https://10.0.0.13:2379,https://10.0.0.14:2379,https://10.0.0.9:2379,https://10.0.0.7:2379 --cacert="ca.pem" --cert="node-kubernetes-test-k8s-master-ne-1.pem" --key="node-kubernetes-test-k8s-master-ne-1-key.pem" member remove 503e0d1f76136e08
- Terminate the connection to the master node.
- Start the
kaasctlDocker interactive session. - Recreate the cluster by running:
kaasctl cluster create <cluster-name> --skip-infra
- Log in to the master node.
- Verify the etcd node status by running the
etcdctl endpoint healthandetcdctl member listcommands.
NOTE: If you want to replace more than one etcd node, you must perform this full procedure for each node.
Replace a load balancer in OpenStack
By default, Rackspace KaaS deploys the following load balancers:
- The Kubernetes API (deployed by using Terraform - all others are deployed by using Kubernetes)
- Ingress Controller
- The Docker registry
All load balancers that are deployed outside of the rackspace-system namespace are managed by the customer.
If a load balancer fails or is in an unrecoverable state, use the openstack loadbalancer failover <lb-id> to replace it. This command works for OpenStack Queens or later.
To replace a load balancer, complete the following steps:
- Replace a load balancer:
openstack loadbalancer failover <lb-id>
- Optionally, verify the Kubernetes operation by using
kubectl:
kubectl get nodes
The command returns a list of Kubernetes nodes.
Update the rpc-environments repository
Every time you make a change to the Terraform environment, such as replacing a node or a load balancer, you must update the rpc-environments repository with the new Terraform *.tfstate file.
To update the *.tfstate file in the rpc-environments repository:
- Copy the
<provider-dir>/clusters/<cluster-name>/terraform-<cluster>.tfstateto/tmp. - Find the customer’s vault encryption password in the PasswordSafe project.
- Encrypt the
*.tfstatefile copy in/tmpwithansible-vault:
root@infra01:/tmp$ ansible-vault encrypt /tmp/terraform-my-cluster.tfstate
New Vault password:
Confirm New Vault password:
Encryption successful
- Create a PR in the customer’s project in the
https://github.com/rpc-environments/<customer-id>repository with the updated file.
Network configuration
This section describes some of the KaaS networking concepts, such as network policies, traffic flow, and so on.
- Configure network policies
- Network traffic flow in a worker node
- Routing table
- Analyze IP packets using tcpdump
Configure network policies
A network policy is a specification of how groups of pods are allowed to communicate with each other and other network endpoints. Network policies are supported in Kubernetes with certain Container Network Interface (CNI) providers, such as Calico and Canal.
By default, Kubernetes clusters are shipped with the Calico CNI provider, which implements network policies.
Calico pods must be running when you execute the following kubectl command:
kubectl -n kube-system get pods | grep calico
kube-calico-gvqpd                                 2/2       Running   0          1h
kube-calico-hkwph                                 2/2       Running   0          1h
kube-calico-hp8hv                                 2/2       Running   0          1h
kube-calico-jlqxg                                 2/2       Running   0          1h
kube-calico-p0kl9                                 2/2       Running   0          1h
kube-calico-pkf1f                                 2/2       Running   0          1h
Verify a network policy
By default, Calico allows all ingress and egress traffic to go in and out of Pods. To see network policies in action, follow the instructions in this demo guide. In addition, see Configure network policies.
Network traffic flow in a worker node
During the deployment, the Kubernetes Installer creates many network ports on the Kubernetes worker node. The following table describes these ports and their function:
Worker node networking ports
| Network interface | Description |
|---|---|
calicNNN | Ports created by Calico for Kubernetes pods. Every time the Kubernetes Installer or you create a pod, Calico creates a calicNNN network interface and connects it to the container by using the Container Network Interface (CNI) plugin. |
docker0 | An interface that is created by default during the cluster deployment, but is not used for any traffic. |
kube-ipvs0 | An IP Virtual Server (IPVS) interface that kube-proxy uses to distribute traffic through the Linux Virtual Server (LVS) kernel module. |
eth0 | An Ethernet interface that the worker node uses to connect to other nodes in the Kubernetes cluster, OpenStack network, and the external network. |
KaaS deploys kube-calico pods that are responsible for network requests management on each worker node. kube-calico is responsible for setting up a Border Gateway Protocol (BGP) mesh between each node while also being responsible for applying related network policies.
The following diagram describes traffic flow from the pod’s network interface to the eth0:
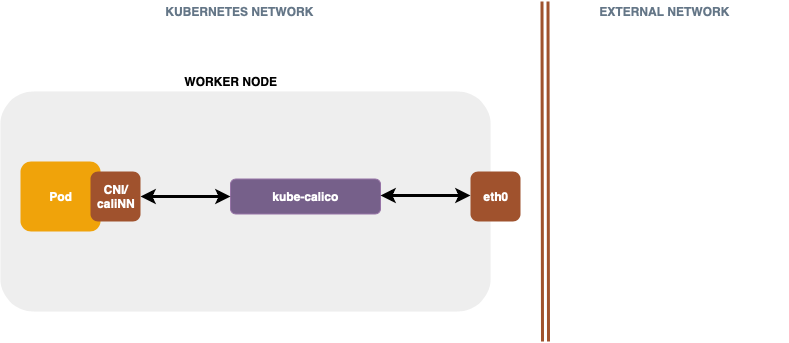
kube-calico configures routing and other important networking settings. In the diagram above, network traffic goes from the pod’s caliNNN interface to kube-calico, which applies network policies, such as blocking certain network ports and so on. From kube-calico, the traffic goes straight to eth0 and is routed as the next hop to Calico on the destination host.
Another way of processing traffic inside a worker is by using kube-proxy. kuber-proxy acts as an internal load balancer and processes network traffic for Kubernetes services with Type=NodePorts, such as MySQL, Reddis, and so on.
The following diagram describes traffic flow from the eth0 to kube-proxy.
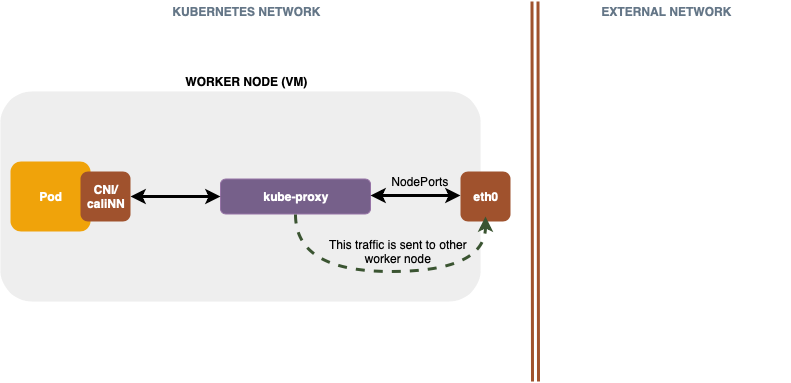
In the diagram above, kube-proxy receives traffic and sends it either to a pod on this worker node or back to eth0 and to another worker node that has other replicas of that pod to process the request.
For more information about how kube-proxy uses LVS and IPVS, see IPVS-Based In-Cluster Load Balancing Deep Dive.
Routing table
Calico is responsible for delivering IP packets to and from Kubernetes pods. When a pod sends an Address Resolution Protocol (ARP) request, Calico is always the next IP hop on the packet delivery journey. Calico applies the iptables rules to the request and then sends them to the other pod directly, kube-proxy, or sends them outside the Kubernetes cluster through the tenant network. The routing information is stored in a Linux routing table on the Calico worker node.
The following text is an example of a routing table on a worker node:
$ route
1: lo: <LOOPBACK,UP,LOWER_UP> mtu 65536 qdisc noqueue state UNKNOWN group default qlen 1000
    link/loopback 00:00:00:00:00:00 brd 00:00:00:00:00:00
    inet 127.0.0.1/8 scope host lo
       valid_lft forever preferred_lft forever
    inet6 ::1/128 scope host
       valid_lft forever preferred_lft forever
2: eth0: <BROADCAST,MULTICAST,UP,LOWER_UP> mtu 1450 qdisc pfifo_fast state UP group default qlen 1000
    link/ether fa:16:3e:bf:cb:fc brd ff:ff:ff:ff:ff:ff
    inet 10.0.0.6/24 brd 10.0.0.255 scope global dynamic eth0
       valid_lft 76190sec preferred_lft 76190sec
    inet6 fe80::f816:3eff:febf:cbfc/64 scope link
       valid_lft forever preferred_lft forever
3: docker0: <NO-CARRIER,BROADCAST,MULTICAST,UP> mtu 1500 qdisc noqueue state DOWN group default
    link/ether 02:42:48:7e:36:f2 brd ff:ff:ff:ff:ff:ff
    inet 172.17.0.1/16 brd 172.17.255.255 scope global docker0
       valid_lft forever preferred_lft forever
    inet6 fe80::42:48ff:fe7e:36f2/64 scope link
       valid_lft forever preferred_lft forever
6: kube-ipvs0: <BROADCAST,NOARP,UP,LOWER_UP> mtu 1500 qdisc noqueue state UNKNOWN group default
    link/ether 76:42:b6:e4:24:cf brd ff:ff:ff:ff:ff:ff
    inet 10.3.0.1/32 brd 10.3.0.1 scope global kube-ipvs0
       valid_lft forever preferred_lft forever
    inet 10.3.0.3/32 brd 10.3.0.3 scope global kube-ipvs0
       valid_lft forever preferred_lft forever
    inet 10.3.55.252/32 brd 10.3.55.252 scope global kube-ipvs0
       valid_lft forever preferred_lft forever
    inet 10.3.248.85/32 brd 10.3.248.85 scope global kube-ipvs0
       valid_lft forever preferred_lft forever
    inet 172.99.65.142/32 brd 172.99.65.142 scope global kube-ipvs0
       valid_lft forever preferred_lft forever
    inet 10.3.125.227/32 brd 10.3.125.227 scope global kube-ipvs0
       valid_lft forever preferred_lft forever
    inet 10.3.201.201/32 brd 10.3.201.201 scope global kube-ipvs0
       valid_lft forever preferred_lft forever
    inet 10.3.92.5/32 brd 10.3.92.5 scope global kube-ipvs0
       valid_lft forever preferred_lft forever
    inet 10.3.169.148/32 brd 10.3.169.148 scope global kube-ipvs0
       valid_lft forever preferred_lft forever
    inet 10.3.131.23/32 brd 10.3.131.23 scope global kube-ipvs0
       valid_lft forever preferred_lft forever
    inet 10.3.202.25/32 brd 10.3.202.25 scope global kube-ipvs0
       valid_lft forever preferred_lft forever
    inet 10.3.232.245/32 brd 10.3.232.245 scope global kube-ipvs0
       valid_lft forever preferred_lft forever
    inet 10.3.249.193/32 brd 10.3.249.193 scope global kube-ipvs0
       valid_lft forever preferred_lft forever
    inet 10.3.198.106/32 brd 10.3.198.106 scope global kube-ipvs0
       valid_lft forever preferred_lft forever
    inet 10.3.81.64/32 brd 10.3.81.64 scope global kube-ipvs0
       valid_lft forever preferred_lft forever
    inet 10.3.66.106/32 brd 10.3.66.106 scope global kube-ipvs0
       valid_lft forever preferred_lft forever
    inet 10.3.121.31/32 brd 10.3.121.31 scope global kube-ipvs0
       valid_lft forever preferred_lft forever
    inet 10.3.13.82/32 brd 10.3.13.82 scope global kube-ipvs0
       valid_lft forever preferred_lft forever
    inet 10.3.156.254/32 brd 10.3.156.254 scope global kube-ipvs0
       valid_lft forever preferred_lft forever
    inet 10.3.179.85/32 brd 10.3.179.85 scope global kube-ipvs0
       valid_lft forever preferred_lft forever
    inet 10.3.20.113/32 brd 10.3.20.113 scope global kube-ipvs0
       valid_lft forever preferred_lft forever
    inet 10.3.94.143/32 brd 10.3.94.143 scope global kube-ipvs0
       valid_lft forever preferred_lft forever
    inet 10.3.188.170/32 brd 10.3.188.170 scope global kube-ipvs0
       valid_lft forever preferred_lft forever
    inet 10.3.10.65/32 brd 10.3.10.65 scope global kube-ipvs0
       valid_lft forever preferred_lft forever
    inet 10.3.171.165/32 brd 10.3.171.165 scope global kube-ipvs0
       valid_lft forever preferred_lft forever
    inet 10.3.141.154/32 brd 10.3.141.154 scope global kube-ipvs0
       valid_lft forever preferred_lft forever
    inet 10.3.159.18/32 brd 10.3.159.18 scope global kube-ipvs0
       valid_lft forever preferred_lft forever
    inet 10.3.35.42/32 brd 10.3.35.42 scope global kube-ipvs0
       valid_lft forever preferred_lft forever
    inet 10.3.248.76/32 brd 10.3.248.76 scope global kube-ipvs0
       valid_lft forever preferred_lft forever
    inet 10.3.133.73/32 brd 10.3.133.73 scope global kube-ipvs0
       valid_lft forever preferred_lft forever
    inet 10.3.65.201/32 brd 10.3.65.201 scope global kube-ipvs0
       valid_lft forever preferred_lft forever
    inet 10.3.118.116/32 brd 10.3.118.116 scope global kube-ipvs0
       valid_lft forever preferred_lft forever
    inet 10.3.82.120/32 brd 10.3.82.120 scope global kube-ipvs0
       valid_lft forever preferred_lft forever
    inet 10.3.223.10/32 brd 10.3.223.10 scope global kube-ipvs0
       valid_lft forever preferred_lft forever
    inet 10.3.52.96/32 brd 10.3.52.96 scope global kube-ipvs0
       valid_lft forever preferred_lft forever
    inet6 fe80::7442:b6ff:fee4:24cf/64 scope link
       valid_lft forever preferred_lft forever
9: caliac52d399c5c@if3: <BROADCAST,MULTICAST,UP,LOWER_UP> mtu 1500 qdisc noqueue state UP group default
    link/ether ee:ee:ee:ee:ee:ee brd ff:ff:ff:ff:ff:ff link-netnsid 0
    inet6 fe80::ecee:eeff:feee:eeee/64 scope link
       valid_lft forever preferred_lft forever
10: cali94f5a40346e@if3: <BROADCAST,MULTICAST,UP,LOWER_UP> mtu 1500 qdisc noqueue state UP group default
    link/ether ee:ee:ee:ee:ee:ee brd ff:ff:ff:ff:ff:ff link-netnsid 1
    inet6 fe80::ecee:eeff:feee:eeee/64 scope link
       valid_lft forever preferred_lft forever
11: calif9c60118c9d@if3: <BROADCAST,MULTICAST,UP,LOWER_UP> mtu 1500 qdisc noqueue state UP group default
    link/ether ee:ee:ee:ee:ee:ee brd ff:ff:ff:ff:ff:ff link-netnsid 2
    inet6 fe80::ecee:eeff:feee:eeee/64 scope link
       valid_lft forever preferred_lft forever
12: cali12440b20ff9@if3: <BROADCAST,MULTICAST,UP,LOWER_UP> mtu 1500 qdisc noqueue state UP group default
    link/ether ee:ee:ee:ee:ee:ee brd ff:ff:ff:ff:ff:ff link-netnsid 3
    inet6 fe80::ecee:eeff:feee:eeee/64 scope link
       valid_lft forever preferred_lft forever
13: cali646ffb1b67d@if3: <BROADCAST,MULTICAST,UP,LOWER_UP> mtu 1500 qdisc noqueue state UP group default
    link/ether ee:ee:ee:ee:ee:ee brd ff:ff:ff:ff:ff:ff link-netnsid 4
    inet6 fe80::ecee:eeff:feee:eeee/64 scope link
       valid_lft forever preferred_lft forever
14: cali315a9d1eed9@if3: <BROADCAST,MULTICAST,UP,LOWER_UP> mtu 1500 qdisc noqueue state UP group default
    link/ether ee:ee:ee:ee:ee:ee brd ff:ff:ff:ff:ff:ff link-netnsid 5
    inet6 fe80::ecee:eeff:feee:eeee/64 scope link
       valid_lft forever preferred_lft forever
15: cali3913b4bb0e1@if3: <BROADCAST,MULTICAST,UP,LOWER_UP> mtu 1500 qdisc noqueue state UP group default
    link/ether ee:ee:ee:ee:ee:ee brd ff:ff:ff:ff:ff:ff link-netnsid 6
    inet6 fe80::ecee:eeff:feee:eeee/64 scope link
       valid_lft forever preferred_lft forever
All internal tenant network traffic is served inside of the 10.0.0.0 network (kube-proxy) through the kube-ipvs0 interface. kube-proxy creates IPVSs for each Service IP address respectively.
In the example above, Calico uses the 169.254.169.254 gateway to apply its iptables rules.
The following text is an example of a routing table on a pod:
/ # route
Kernel IP routing table
Destination     Gateway         Genmask         Flags Metric Ref    Use Iface
default         169.254.1.1     0.0.0.0         UG    0      0        0 eth0
169.254.1.1     *               255.255.255.255 UH    0      0        0 eth0
In the example above,169.254.1.1 is the Calico gateway.
Analyze IP packets using tcpdump
You can use the tcpdump tool to analyze IP packets transmitted to and from pods on a Kubernetes node.
To use tcpdump, complete the following steps:
- If you want to generate network traffic for testing purposes, install the
net-toolsprobe on your node:
apiVersion: apps/v1
kind: Deployment
metadata:x
  name: net-tools-deployment
  labels:
    app: net-tools
spec:
  replicas: 1
  selector:
    matchLabels:
      app: net-tools
  template:
    metadata:
      labels:
        app: net-tools
    spec:
      containers:
      - name: nettools
        image: raesene/alpine-nettools
- Determine the worker node on which the pod that you want to monitor is running.
- Log in to the pod:
Example:
(kubernetes-xgerman/rackspace-system) installer $ kubectl -it exec prometheus-k8s-1 /bin/sh
Example of system response:
Defaulting container name to prometheus.
Use 'kubectl describe pod/prometheus-k8s-1' to see all of the containers in this pod.
In the example above, we log in to a Prometheus pod.
- List all IP addresses on the pod’s network interface:
/prometheus $ ip a
Example of system response:
1: lo: <LOOPBACK,UP,LOWER_UP> mtu 65536 qdisc noqueue qlen 1000
    link/loopback 00:00:00:00:00:00 brd 00:00:00:00:00:00
    inet 127.0.0.1/8 scope host lo
    valid_lft forever preferred_lft forever
2: tunl0@NONE: <NOARP> mtu 1480 qdisc noop qlen 1000
    link/ipip 0.0.0.0 brd 0.0.0.0
4: eth0@if15: <BROADCAST,MULTICAST,UP,LOWER_UP,M-DOWN> mtu 1400 qdisc noqueue
    link/ether 22:77:54:21:7c:0f brd ff:ff:ff:ff:ff:ff
    inet 10.2.5.10/32 scope global eth0
       valid_lft forever preferred_lft forever
- Remember the network address for
eth0. - Ping . he pod from the probe.
Example:
5676-c4h6z /bin/sh
/ # ping 10.2.5.10
Example of system response:
PING 10.2.5.10 (10.2.5.10): 56 data bytes
64 bytes from 10.2.5.10: seq=0 ttl=62 time=1.725 ms
64 bytes from 10.2.5.10: seq=1 ttl=62 time=1.250 ms
64 bytes from 10.2.5.10: seq=2 ttl=62 time=1.122 ms
64 bytes from 10.2.5.10: seq=3 ttl=62 time=1.369 ms
64 bytes from 10.2.5.10: seq=4 ttl=62 time=0.771 ms
64 bytes from 10.2.5.10: seq=5 ttl=62 time=0.725 ms
- Log in to the worker node.
- Validate that traffic gets to the node:
sudo tcpdump -i eth0 icmp
Example of system response:
dropped privs to tcpdump
tcpdump: verbose output suppressed, use -v or -vv for full protocol decode
listening on flannel.1, link-type EN10MB (Ethernet), capture size 262144 bytes
21:35:34.662425 IP 10.2.3.15 > 10.2.5.10: ICMP echo request, id 11520, seq 60, length 64
21:35:34.662483 IP 10.2.5.10 > 10.2.3.15: ICMP echo reply, id 11520, seq 60, length 64
21:35:35.662860 IP 10.2.3.15 > 10.2.5.10: ICMP echo request, id 11520, seq 61, length 64
21:35:35.663682 IP 10.2.5.10 > 10.2.3.15: ICMP echo reply, id 11520, seq 61, length 64
21:35:36.663004 IP 10.2.3.15 > 10.2.5.10: ICMP echo request, id 11520, seq 62, length 64
21:35:36.663086 IP 10.2.5.10 > 10.2.3.15: ICMP echo reply, id 11520, seq 62, length 64
21:35:37.663531 IP 10.2.3.15 > 10.2.5.10: ICMP echo request, id 11520, seq 63, length 64
21:35:37.663596 IP 10.2.5.10 > 10.2.3.15: ICMP echo reply, id 11520, seq 63, length 64
21:35:38.663694 IP 10.2.3.15 > 10.2.5.10: ICMP echo request, id 11520, seq 64, length 64
21:35:38.663784 IP 10.2.5.10 > 10.2.3.15: ICMP echo reply, id 11520, seq 64, length 64
21:35:39.663464 IP 10.2.3.15 > 10.2.5.10: ICMP echo request, id 11520, seq 65, length 64
21:35:39.663556 IP 10.2.5.10 > 10.2.3.15: ICMP echo reply, id 11520, seq 65, length 64
21:35:40.664055 IP 10.2.3.15 > 10.2.5.10: ICMP echo request, id 11520, seq 66, length 64
21:35:40.664141 IP 10.2.5.10 > 10.2.3.15: ICMP echo reply, id 11520, seq 66, length 64
- Get the name of the pod (
caliNNN) network interface by its IP address:
Example:
route | grep 10.2.5.10
Example of system response:
10.2.5.10 0.0.0.0 255.255.255.255 UH 0 0 0 calie2afdf225c0
-
Validate the traffic on the pod’s (
caliNNN) network interface:Example:
sudo tcpdump -i calie2afdf225c0 icmp
Example of system response:
dropped privs to tcpdump
tcpdump: verbose output suppressed, use -v or -vv for full protocol decode
listening on calie2afdf225c0, link-type EN10MB (Ethernet), capture size 262144 bytes
21:37:36.693484 IP 10.2.3.15 > 10.2.5.10: ICMP echo request, id 11520, seq 182, length 64
21:37:36.693544 IP 10.2.5.10 > 10.2.3.15: ICMP echo reply, id 11520, seq 182, length 64
21:37:37.693764 IP 10.2.3.15 > 10.2.5.10: ICMP echo request, id 11520, seq 183, length 64
21:37:37.693802 IP 10.2.5.10 > 10.2.3.15: ICMP echo reply, id 11520, seq 183, length 64
21:37:38.693562 IP 10.2.3.15 > 10.2.5.10: ICMP echo request, id 11520, seq 184, length 64
21:37:38.693601 IP 10.2.5.10 > 10.2.3.15: ICMP echo reply, id 11520, seq 184, length 64
21:37:39.693902 IP 10.2.3.15 > 10.2.5.10: ICMP echo request, id 11520, seq 185, length 64
21:37:39.693943 IP 10.2.5.10 > 10.2.3.15: ICMP echo reply, id 11520, seq 185, length 64
Add resource limits to applications
Resource limits are a critical part of a production deployment. Without defined limits, Kubernetes overschedules workloads, leading to “noisy neighbor” problems. Such behavior is particularly troublesome for workloads that come in bursts, which might expand to use all of the available resources on a Kubernetes worker node.
Adding resource limits
Kubernetes has the following classes of resource constraints: limit and request. The request attribute is a soft limit, which might be exceeded if extra resources are available. The limit attribute is a hard limit, which prevents scheduling if worker nodes do not have enough resources available. The limit resource might cause termination of an application if the application attempts to exceed the configured cap.
These limits are specified in the container specification.
Example:
apiVersion: v1
kind: Pod
metadata:
  name: frontend
spec:
  containers:
  - name: db
    image: mysql
    resources:
      requests:
        memory: "64Mi"
        cpu: "250m"
      limits:
        memory: "128Mi"
        cpu: "500m"
Determining resource limits
Profiling actual usage is the best way to set resource limits. Deploy the application without setting any resource limits, run it through a typical set of tasks, and then examine the resource usage in the monitoring dashboard. You might want to set limits somewhat higher than the observed usage to ensure optimal provisioning. Limits can later be tuned downward if necessary.
Troubleshooting
This section describes how to troubleshoot issues with your Kubernetes cluster, managed services, and underlying components of the Rackspace KaaS solution.
- Basic troubleshooting
- Troubleshooting Rackspace KaaS
- Troubleshooting etcd
- Troubleshooting octavia
- Troubleshooting Kubespray
Basic troubleshooting
Maintainers
- Shane Cunningham (@shanec)
To get help from the maintainers, contact them in #kaas by their Slack name.
Kubernetes
Connect to a Kubernetes node
You can access the Kubernetes master nodes by using floating IPs (FIPs).
- To discover the FIPs for the Kubernetes master nodes, set the OpenStack tooling aliases.
- List your OpenStack servers:
$ openstack server list -c Name -c Status -c Networks
+--------------------------+--------+--------------------------------------------------+
| Name                     | Status | Networks                                         |
+--------------------------+--------+--------------------------------------------------+
| etoews-rpc1-iad-master-0 | ACTIVE | etoews-rpc1-iad_network=10.0.0.14, 172.99.77.130 |
| etoews-rpc1-iad-worker-0 | ACTIVE | etoews-rpc1-iad_network=10.0.0.6                 |
| etoews-rpc1-iad-worker-1 | ACTIVE | etoews-rpc1-iad_network=10.0.0.9                 |
| etoews-rpc1-iad-master-2 | ACTIVE | etoews-rpc1-iad_network=10.0.0.7, 172.99.77.107  |
| etoews-rpc1-iad-master-1 | ACTIVE | etoews-rpc1-iad_network=10.0.0.12, 172.99.77.100 |
| etoews-rpc1-iad-worker-2 | ACTIVE | etoews-rpc1-iad_network=10.0.0.10                |
+--------------------------+--------+--------------------------------------------------+
- Export the
SSH_OPTSandMASTER_FIPvariables:
$ export SSH_OPTS="-i clusters/${K8S_CLUSTER_NAME}/id_rsa_core -o UserKnownHostsFile=/dev/null -o StrictHostKeyChecking=no"

$ export MASTER_FIP=172.99.77.130
- Connect to the Kubernetes master node:
$ ssh ${SSH_OPTS} core@${MASTER_FIP}
- Get the
kubeletlogs:
core@clustername-master-0 ~ $ journalctl -u kubelet
By default, Kubernetes worker nodes are not publicly available as they do not have an assigned floating IP address (FIP). To connect to a Kubernetes worker node, first copy the SSH private key located in clusters/*clustername*/id_rsa on the machine from which you deployed the Kubernetes cluster (your laptop or an OpenStack infrastructure node) to a Kubernetes master node and all worker nodes. Then, you can connect to a Kubernetes worker node from the Kubernetes master node.
$ scp ${SSH_OPTS} clusters/${K8S_CLUSTER_NAME}/id_rsa_core core@${MASTER_FIP}:.

$ ssh ${SSH_OPTS} core@${MASTER_FIP}

core@clustername-master-0 ~ $ ssh -i id_rsa_core core@<worker-ip>

core@clustername-worker-0 ~ $ journalctl -u kubelet
Diagnose a Kubernetes cluster
You can use the cluster-diagnostics.sh script to get the information about a Kubernetes cluster.
hack/support/cluster-diagnostics.sh
To simplify log gathering, we recommend that you install this gist CLI.
To use the gist CLI, run the following commands:
gist --login

gist --private --copy clusters/${K8S_CLUSTER_NAME}/logs/*.log
The command above uploads the logs to a private. gist and copies the gist URL to your clipboard.
If the Kubernetes API is reachable, the script uses heptio/sonobuoy to gather diagnostics about the cluster. The collected data is accumulated in the clusters/$K8S_CLUSTER_NAME/logs/sonobuoy-diagnostics.$(date +%Y-%m-%dT%H:%M:%S).tar.gz archive. For more information about the contents of the tarball, see the Sonobuoy documentation.
The script uploads the cluster-diagnostics, sonobuoy-diagnostics, and kubernetes-installer logs and tarballs to Cloud Files. However, for this to work you need to configure the K8S_CF_USER and K8S_CF_APIKEY variables from PasswordSafe. You might also need to pull the latest OpenStack CLI client image.
Known Issues
Warning, FailedMount, attachdetach-controller, AttachVolume.Attach, Invalid request due to incorrect syntax or missing required parameters.
An issue with attachdetach-controller might result in the following error message:
kubectl get events --all-namespaces
NAMESPACE          LAST SEEN   FIRST SEEN   COUNT     NAME                                                             KIND      SUBOBJECT   TYPE      REASON        SOURCE                    MESSAGE
monitoring         32m         1d           72        prometheus-customer-0.15333bb2a31a0e4f                           Pod                   Warning   FailedMount   attachdetach-controller   AttachVolume.Attach failed for volume "pvc-c29aceb0-6385-11e8-abfd-fa163eea581f" : Invalid request due to incorrect syntax or missing required parameters.
If you see a message like the one described above in the event log while the volume is bound to a node and mounted to a pod or container, then your Kubernetes cluster might have other issues unrelated to the volume. For more information, see K8S-1105.
Managed services
Image registry
The image registry is implemented using VMware Harbor. For more information, see the VMware Harbor documentation.
Harbor is a subsystem made of highly-coupled microservices. We recommend that you read Harbor architecture overview to understand the product better.
Harbor’s architecture has evolved since the documentation was written and it is still in transition. VMware is adding and changing services constantly and it might take some time until the final architecture is implemented. You might want to read the updated architecture overview PR that can help you understand some of the newer components and all of the coupling.
See also:
- Walkthrough of Harbor running on Managed Kubernetes in Harbor Registry Walkabout.
- The script associated with Harbor Registry Walkabout.
Image registry database
To access the image registry database, run the following commands:
$ REGISTRY_MYSQL_POD_ID=$(kubectl get pods -n rackspace-system | grep registry-mysql | awk '{print $1}')
$ kubectl exec ${REGISTRY_MYSQL_POD_ID} -it -n rackspace-system -- bash
# mysql --user=root --password=$MYSQL_ROOT_PASSWORD --database=registry
mysql> show tables;
mysql> select * from alembic_version;
Elasticsearch
Index pruning
To debug the index pruning, find the latest job run by using the following commands:
$ kubectl get jobs | grep curator
es-purge-1497635820   1         0            3m
$ job=curator-1497635820
$ pods=$(kubectl get pods --selector=job-name=${job} --output=jsonpath={.items..metadata.name})
$ kubectl logs $pods
OpenStack
Connect to an OpenStack environment data plane
Complete the following steps:
-
Connect to the VPN.
-
Choose the OpenStack env from one of the
<env>.<region>.ohthree.comtabs in the Managed Kubernetes PasswordSafe and find the 10.x.x.x IP and root password.- If you need one of the other physical hosts, try searching for the inventory file for your environment and host. If you cannot find it, ask one of the maintainers.
-
Connect to the
control-1node of the OpenStack control plane:
ssh [email protected]
- View each of the control plane services by typing the following commands:
lxc-ls
- Connect to the required service by SSH using the service name. For example:
ssh control-1_cinder_api_container-972603b0
- View the service logs in
/var/log/<servicename>/. For example:
ls /var/log/cinder/
OpenStack tooling
Set up the aliases that can run the OpenStack client to help you troubleshoot your RPC environment using the following commands:
alias osc='docker run -it --rm --volume ${PWD}:/data --env-file <(env | grep OS_) --env PYTHONWARNINGS="ignore:Unverified HTTPS request" quay.io/rackspace/openstack-cli'
alias openstack='osc openstack --insecure'
alias neutron='osc neutron --insecure'
You can use the following aliases:
openstack server list
neutron net-list
OpenStack monitoring
To view the monitoring information for a particular RPCO environment, follow these steps:
- Log in to https://monitoring.rackspace.net using your Rackspace SSO.
- Search for the account environment ID. For example:
rpc1.kubernetes.iad.ohthree.com: 4958307 - Click on Rackspace Intelligence in the navigation bar to access the Cloud Monitoring. You can view checks without leaving to Rackspace Intelligence.
Delete OpenStack resources
Ocasionally, when you delete a Kubernetes cluster, it might result in orphaned resources. To remove these resources, use the following options:
- Delete. Use this command, if you cannot connect to the kubernetes API server.
kaasctl cluster delete <cluster-name>
- OpenStack Dashboard. You can try to delete Kubernetes resources using the Horizon UI. However, its functionality might be limited.
Map OpenStack servers to physical hosts
- Log in to the RPC environment using the admin credentials from one of the
*.kubernetes.ohthree.comtabs in the Managed Kubernetes PasswordSafe. - In the left hand navigation menu, select Admin > Instances.
- In the upper-right corner, filter the instances using
Name =from the dropdown. The physical host is listed in the Host column.
Out of Memory, Kubenetes node is in NotReady status
If you found a node that is in the NotReady status, you can analyze the log file of this machine for potential problems by performing these steps:
- Log in to the OpenStack Horizon UI.
- Go to Project -> Compute -> Instances.
- Select the instance name -> Log -> View full log.
- If you see Memory cgroup out of memory in the log file, this might be the reason of the node in
NotReadystatus. Reboot the node.
- If you see Memory cgroup out of memory in the log file, this might be the reason of the node in
RPC dashboards
The following dashboards deployed in rpc1.kubernetes.iad.ohthree.com might help you troubleshoot issues with your Kubernetes cluster:
-
Elasticsearch, Logstash, and Kibana (ELK):
-
Telegraf, InfluxDB, Grafana, and Kapacitor (TGIK):
Telegraf, InfluxDB, Grafana, and Kapacitor (TGIK) is a new addition to RPC Monitoring-as-a-Service (MaaS). TGIK is a time-series platform that collects metrics from the MaaS plugins and stores them in InfluxDB. Rackspace KaaS uses Grafana to display these time series metrics. In this release, the system, network, and summary dashboards are supported.
- Access: https://rpc1.kubernetes.iad.ohthree.com:8089
- Credentials: None. If you want your own user created contact one of the maintainers.
Troubleshooting Rackspace KaaS
Table of Contents
- DNS
- Logs
- Attach to a pod
- Checking the running configuration
- Namespaces
- Failure domains
- Troubleshooting unresponsive Kubernetes services
DNS
Rackspace Kubernetes-as-a-Service (KaaS) uses OpenStack DNS-as-a-Service (Designate) that provides REST APIs for record management, as well as integrates with the OpenStack Identity service (keystone). When Kubernetes Installer creates Kubernetes nodes, it adds DNS records about the nodes in the Designate DNS zone. Kubernetes Installer also adds records for Ingress Controller, Docker registry, and the Kubernetes API endpoints.
You can use the following commands to retrieve information about your Kubernetes cluster:
- Use the
hostlookup utility to check the IP address of your Kubernetes master node:
 $ host shanec-cluster-master-0.pug.systems
shanec-cluster-master-0.pug.systems has address 148.62.13.55
- Connect to the Kubernetes master node using SSH:
$ ssh -i id_rsa_core [email protected]
Last login: Fri Jun 23 16:49:09 UTC 2017 from 172.99.99.10 on pts/0
Container Linux by CoreOS beta (1409.1.0)
Update Strategy: No Reboots
core@shanec-cluster-master-0 ~ $
Each cluster has its own SSH key credentials in PasswordSafe. The default user in Container Linux is core.
You can apply this operation to all Kubernetes master nodes in the cluster:
$ kubectl get nodes
NAME                      STATUS    AGE       VERSION
shanec-cluster-master-0   Ready     31m       v1.6.4+coreos.0
shanec-cluster-master-1   Ready     31m       v1.6.4+coreos.0
shanec-cluster-master-2   Ready     31m       v1.6.4+coreos.0
shanec-cluster-worker-0   Ready     31m       v1.6.4+coreos.0
shanec-cluster-worker-1   Ready     31m       v1.6.4+coreos.0
shanec-cluster-worker-2   Ready     31m       v1.6.4+coreos.0
Logs
The Rackspace KaaS offering deploys Elasticsearch, Fluentd, and Kibana by default. Also, when troubleshooting pods, you can use the kubectl logs command to inspect pod level logs.
Access Kibana information
Kibana visualizes information about your Kubernetes clusters that is collected and stored in Elasticsearch.
You can use the following commands to retrieve information about your Kubernetes cluster provided by Kibana:
- Access information about Kibana deployments in all namespaces:
$ kubectl get all --all-namespaces -l k8s-app=kibana
NAMESPACE          NAME                          READY     STATUS    RESTARTS   AGE
rackspace-system   pod/kibana-76c4c44bcb-nmspf   1/1       Running   0          15h

NAMESPACE          NAME           TYPE        CLUSTER-IP     EXTERNAL-IP   PORT(S)    AGE
rackspace-system   service/logs   ClusterIP   10.3.160.207   <none>        5601/TCP   15h

NAMESPACE          NAME                           DESIRED   CURRENT   UP-TO-DATE   AVAILABLE   AGE
rackspace-system   deployment.extensions/kibana   1         1         1            1           15h

NAMESPACE          NAME                                      DESIRED   CURRENT   READY     AGE
rackspace-system   replicaset.extensions/kibana-76c4c44bcb   1         1         1         15h

NAMESPACE          NAME                     DESIRED   CURRENT   UP-TO-DATE   AVAILABLE   AGE
rackspace-system   deployment.apps/kibana   1         1         1            1           15h

NAMESPACE          NAME                                DESIRED   CURRENT   READY     AGE
rackspace-system   replicaset.apps/kibana-76c4c44bcb   1         1         1         15h
- By default, Kibana is configured with an ingress resource that enables inbound connections reach Kubernetes services. Each Kubernetes cluster has an ingress fully qualified domain name (FQDN) at
kibana.${K8S_CLUSTER_NAME}.pug.systems. You can view information about ingress resources by running the following command:
$ kubectl get ingress --all-namespaces
NAMESPACE          NAME         HOSTS     ADDRESS   PORTS     AGE
monitoring         prometheus   *                   80        15h
rackspace-system   grafana      *                   80        15h
rackspace-system   kibana       *                   80        15h
rackspace-system   prometheus   *                   80        15h
View information about the Kibana ingress resource by running the following command:
$ kubectl describe ingress -n rackspace-system kibana
System response:
Name:             kibana
Namespace:        rackspace-system
Address:
Default backend:  default-http-backend:80 (<none>)
Rules:
  Host  Path  Backends
  ----  ----  --------
  *
        /logs   logs:5601 (<none>)
Annotations:
  nginx.ingress.kubernetes.io/auth-type:             basic
  nginx.ingress.kubernetes.io/rewrite-target:        /
  nginx.ingress.kubernetes.io/ssl-redirect:          false
  kubectl.kubernetes.io/last-applied-configuration:  {"apiVersion":"extensions/v1beta1","kind":"Ingress","metadata":{"annotations":{"nginx.ingress.kubernetes.io/auth-realm":"Kibana Basic Authentication","nginx.ingress.kubernetes.io/auth-secret":"basic-auth-access","nginx.ingress.kubernetes.io/auth-type":"basic","nginx.ingress.kubernetes.io/rewrite-target":"/","nginx.ingress.kubernetes.io/ssl-redirect":"false"},"labels":{"k8s-app":"kibana"},"name":"kibana","namespace":"rackspace-system"},"spec":{"rules":[{"http":{"paths":[{"backend":{"serviceName":"logs","servicePort":5601},"path":"/logs"}]}}]}}

  nginx.ingress.kubernetes.io/auth-realm:   Kibana Basic Authentication
  nginx.ingress.kubernetes.io/auth-secret:  basic-auth-access
Events:                                     <none>
- Access the Kibana web user interface (WUI) at
https://kibana.${DOMAIN}. Use the credentials stored in PasswordSafe.
Analyze pod logs
Sometimes issues occur with specific pods. For example, a pod might be in a restart loop because the health check is failing. You can check pod logs in Kibana or you can check pod logs from the Kubernetes cluster directly.
To analyze pod issues, use the following instructions:
- Get information about pods:
kubectl get pods
For example, you have the following pod with errors:
rackspace-system po/elasticsearch-3003189550-9k8nz 0/1 Error 26 4h
- Search the log file for the error information about this pod:
$ kubectl logs po/elasticsearch-3003189550-9k8nz -n rackspace-system
System response:
[2017-06-21T23:35:15,680][INFO ][o.e.n.Node               ] [] initializing ...
[2017-06-21T23:35:15,826][INFO ][o.e.e.NodeEnvironment    ] [f_DBfoM] using [1] data paths, mounts [[/ (overlay)]], net usable_space [86.3gb], net total_space [94.5gb], spins? [unknown], types [overlay]
[2017-06-21T23:35:15,827][INFO ][o.e.e.NodeEnvironment    ] [f_DBfoM] heap size [371.2mb], compressed ordinary object pointers [true]
[2017-06-21T23:35:15,830][INFO ][o.e.n.Node               ] node name [f_DBfoM] derived from node ID [f_DBfoMATZS89ap-852SWQ]; set [node.name] to override
[2017-06-21T23:35:15,830][INFO ][o.e.n.Node               ] version[5.3.0], pid[1], build[3adb13b/2017-03-23T03:31:50.652Z], OS[Linux/4.11.6-coreos/amd64], JVM[Oracle Corporation/OpenJDK 64-Bit Server VM/1.8.0_92-internal/25.92-b14]
[2017-06-21T23:35:19,067][INFO ][o.e.p.PluginsService     ] [f_DBfoM] loaded module [aggs-matrix-stats]
[2017-06-21T23:35:19,067][INFO ][o.e.p.PluginsService     ] [f_DBfoM] loaded module [ingest-common]
[2017-06-21T23:35:19,068][INFO ][o.e.p.PluginsService     ] [f_DBfoM] loaded module [lang-expression]
[2017-06-21T23:35:19,068][INFO ][o.e.p.PluginsService     ] [f_DBfoM] loaded module [lang-groovy]
[2017-06-21T23:35:19,068][INFO ][o.e.p.PluginsService     ] [f_DBfoM] loaded module [lang-mustache]
[2017-06-21T23:35:19,068][INFO ][o.e.p.PluginsService     ] [f_DBfoM] loaded module [lang-painless]
[2017-06-21T23:35:19,069][INFO ][o.e.p.PluginsService     ] [f_DBfoM] loaded module [percolator]
[2017-06-21T23:35:19,069][INFO ][o.e.p.PluginsService     ] [f_DBfoM] loaded module [reindex]
[2017-06-21T23:35:19,069][INFO ][o.e.p.PluginsService     ] [f_DBfoM] loaded module [transport-netty3]
[2017-06-21T23:35:19,069][INFO ][o.e.p.PluginsService     ] [f_DBfoM] loaded module [transport-netty4]
[2017-06-21T23:35:19,070][INFO ][o.e.p.PluginsService     ] [f_DBfoM] loaded plugin [x-pack]
[2017-06-21T23:35:24,974][INFO ][o.e.n.Node               ] initialized
[2017-06-21T23:35:24,975][INFO ][o.e.n.Node               ] [f_DBfoM] starting ...
[2017-06-21T23:35:25,393][WARN ][i.n.u.i.MacAddressUtil   ] Failed to find a usable hardware address from the network interfaces; using random bytes: 80:8d:a8:63:81:52:00:ce
[2017-06-21T23:35:25,518][INFO ][o.e.t.TransportService   ] [f_DBfoM] publish_address {10.2.4.10:9300}, bound_addresses {[::]:9300}
[2017-06-21T23:35:25,531][INFO ][o.e.b.BootstrapChecks    ] [f_DBfoM] bound or publishing to a non-loopback or non-link-local address, enforcing bootstrap checks
ERROR: bootstrap checks failed
max virtual memory areas vm.max_map_count [65530] is too low, increase to at least [262144]
[2017-06-21T23:35:25,575][INFO ][o.e.n.Node               ] [f_DBfoM] stopping ...
[2017-06-21T23:35:25,665][INFO ][o.e.n.Node               ] [f_DBfoM] stopped
[2017-06-21T23:35:25,666][INFO ][o.e.n.Node               ] [f_DBfoM] closing ...
[2017-06-21T23:35:25,691][INFO ][o.e.n.Node               ] [f_DBfoM] closed
In the output above, the pod is failing because of the following error:
ERROR: bootstrap checks failed max virtual memory areas vm.max_map_count
[65530] is too low, increase to at least [262144].
When you see this error, you might need to investigate the deployment or pod YAML.
- View the Ingress Controller pod log tail:
$ kubectl logs nginx-ingress-controller-294216488-ncfq9 -n rackspace-system --tail=3
::ffff:172.99.99.10 - [::ffff:172.99.99.10] - - [23/Jun/2017:18:08:18 +0000] "POST /logs/api/monitoring/v1/clusters HTTP/2.0" 200 974 "https://148.62.13.65/logs/app/monitoring" "Mozilla/5.0 (Macintosh; Intel Mac OS X 10.12; rv:45.0) Gecko/20100101 Firefox/45.0" 117 0.124 [kube-system-logs-5601] 10.2.0.3:5601 751 0.124 200"
::ffff:172.99.99.10 - [::ffff:172.99.99.10] - - [23/Jun/2017:18:08:33 +0000] "GET /logs/api/reporting/jobs/list_completed_since?since=2017-06-23T17:26:26.119Z HTTP/2.0" 200 262 "https://148.62.13.65/logs/app/monitoring" "Mozilla/5.0 (Macintosh; Intel Mac OS X 10.12; rv:45.0) Gecko/20100101 Firefox/45.0" 66 0.024 [kube-system-logs-5601] 10.2.0.3:5601 37 0.024 200"
::ffff:172.99.99.10 - [::ffff:172.99.99.10] - - [23/Jun/2017:18:08:33 +0000] "POST /logs/api/monitoring/v1/clusters HTTP/2.0" 200 974 "https://148.62.13.65/logs/app/monitoring" "Mozilla/5.0 (Macintosh; Intel Mac OS X 10.12; rv:45.0) Gecko/20100101 Firefox/45.0" 117 0.160 [kube-system-logs-5601] 10.2.0.3:5601 751 0.160 200"
- To get detailed output, run the
kubectl logscommand in the verbose mode:
$ kubectl logs nginx-ingress-controller-294216488-ncfq9 -n rackspace-system --tail=3 --v=99
System response
I0623 13:10:51.867425   35338 loader.go:354] Config loaded from file /Users/shan5490/code/kubernetes/managed-kubernetes/kubernetes-installer-myfork/clusters/shanec-cluster/generated/auth/kubeconfig
I0623 13:10:51.868737   35338 cached_discovery.go:118] returning cached discovery info from /Users/shan5490/.kube/cache/discovery/shanec_cluster_k8s.pug.systems_443/servergroups.json
I0623 13:10:51.874469   35338 cached_discovery.go:118] returning cached discovery info from /Users/shan5490/.kube/cache/discovery/shanec_cluster_k8s.pug.systems_443/servergroups.json

...

I0623 13:10:51.874602   35338 round_trippers.go:398] curl -k -v -XGET  -H "Accept: application/json, */*" -H "User-Agent: kubectl/v1.6.6 (darwin/amd64) kubernetes/7fa1c17" https://shanec-cluster-k8s.pug.systems:443/api/v1/namespaces/kube-system/pods/nginx-ingress-controller-294216488-ncfq9
I0623 13:10:52.044683   35338 round_trippers.go:417] GET https://shanec-cluster-k8s.pug.systems:443/api/v1/namespaces/kube-system/pods/nginx-ingress-controller-294216488-ncfq9 200 OK in 170 milliseconds
I0623 13:10:52.044731   35338 round_trippers.go:423] Response Headers:
I0623 13:10:52.044744   35338 round_trippers.go:426]     Content-Type: application/json
I0623 13:10:52.044751   35338 round_trippers.go:426]     Content-Length: 3396
I0623 13:10:52.044757   35338 round_trippers.go:426]     Date: Fri, 23 Jun 2017 18:10:52 GMT
I0623 13:10:52.045303   35338 request.go:991] Response Body: {"kind":"Pod","apiVersion":"v1","metadata":{"name":"nginx-ingress-controller-294216488-ncfq9","generateName":"nginx-ingress-controller-294216488-","namespace":"kube-system","selfLink":"/api/v1/namespaces/kube-system/pods/nginx-ingress-controller-294216488-ncfq9","uid":"49f7b2f2-5833-11e7-b991-fa163e0178f4","resourceVersion":"1584","creationTimestamp":"2017-06-23T16:44:56Z","labels":{"k8s-app":"nginx-ingress-controller","pod-template-hash":"294216488"},"annotations":{"kubernetes.io/created-by":"{\"kind\":\"SerializedReference\",\"apiVersion\":\"v1\",\"reference\":{\"kind\":\"ReplicaSet\",\"namespace\":\"kube-system\",\"name\":\"nginx-ingress-controller-294216488\",\"uid\":\"49ed0172-5833-11e7-b991-fa163e0178f4\",\"apiVersion\":\"extensions\",\"resourceVersion\":\"1383\"}}\n"},"ownerReferences":[{"apiVersion":"extensions/v1beta1","kind":"ReplicaSet","name":"nginx-ingress-controller-294216488","uid":"49ed0172-5833-11e7-b991-fa163e0178f4","controller":true,"blockOwnerDeletion":true}]},"spec":{"volumes":[{"name":"default-token-b6f5v","secret":{"secretName":"default-token-b6f5v","defaultMode":420}}],"containers":[{"name":"nginx-ingress-controller","image":"gcr.io/google_containers/nginx-ingress-controller:0.9.0-beta.3","args":["/nginx-ingress-controller","--default-backend-service=$(POD_NAMESPACE)/default-http-backend"],"ports":[{"hostPort":80,"containerPort":80,"protocol":"TCP"},{"hostPort":443,"containerPort":443,"protocol":"TCP"}],"env":[{"name":"POD_NAME","valueFrom":{"fieldRef":{"apiVersion":"v1","fieldPath":"metadata.name"}}},{"name":"POD_NAMESPACE","valueFrom":{"fieldRef":{"apiVersion":"v1","fieldPath":"metadata.namespace"}}}],"resources":{},"volumeMounts":[{"name":"default-token-b6f5v","readOnly":true,"mountPath":"/var/run/secrets/kubernetes.io/serviceaccount"}],"livenessProbe":{"httpGet":{"path":"/healthz","port":10254,"scheme":"HTTP"},"initialDelaySeconds":10,"timeoutSeconds":1,"periodSeconds":10,"successThreshold":1,"failureThreshold":3},"readinessProbe":{"httpGet":{"path":"/healthz","port":10254,"scheme":"HTTP"},"timeoutSeconds":1,"periodSeconds":10,"successThreshold":1,"failureThreshold":3},"terminationMessagePath":"/dev/termination-log","terminationMessagePolicy":"File","imagePullPolicy":"IfNotPresent"}],"restartPolicy":"Always","terminationGracePeriodSeconds":60,"dnsPolicy":"ClusterFirst","serviceAccountName":"default","serviceAccount":"default","nodeName":"shanec-cluster-worker-1","hostNetwork":true,"securityContext":{},"schedulerName":"default-scheduler"},"status":{"phase":"Running","conditions":[{"type":"Initialized","status":"True","lastProbeTime":null,"lastTransitionTime":"2017-06-23T16:44:56Z"},{"type":"Ready","status":"True","lastProbeTime":null,"lastTransitionTime":"2017-06-23T16:45:26Z"},{"type":"PodScheduled","status":"True","lastProbeTime":null,"lastTransitionTime":"2017-06-23T16:44:56Z"}],"hostIP":"148.62.13.65","podIP":"148.62.13.65","startTime":"2017-06-23T16:44:56Z","containerStatuses":[{"name":"nginx-ingress-controller","state":{"running":{"startedAt":"2017-06-23T16:45:12Z"}},"lastState":{},"ready":true,"restartCount":0,"image":"gcr.io/google_containers/nginx-ingress-controller:0.9.0-beta.3","imageID":"docker-pullable://gcr.io/google_containers/nginx-ingress-controller@sha256:995427304f514ac1b70b2c74ee3c6d4d4ea687fb2dc63a1816be15e41cf0e063","containerID":"docker://2b93a3253696a1498dbe718b0eeb553fde2335f14a81e30837a6fe057d457264"}],"qosClass":"BestEffort"}}
I0623 13:10:52.047274   35338 round_trippers.go:398] curl -k -v -XGET  -H "Accept: application/json, */*" -H "User-Agent: kubectl/v1.6.6 (darwin/amd64) kubernetes/7fa1c17" https://shanec-cluster-k8s.pug.systems:443/api/v1/namespaces/kube-system/pods/nginx-ingress-controller-294216488-ncfq9/log?tailLines=3
I0623 13:10:52.082334   35338 round_trippers.go:417] GET https://shanec-cluster-k8s.pug.systems:443/api/v1/namespaces/kube-system/pods/nginx-ingress-controller-294216488-ncfq9/log?tailLines=3 200 OK in 35 milliseconds
I0623 13:10:52.082358   35338 round_trippers.go:423] Response Headers:
I0623 13:10:52.082364   35338 round_trippers.go:426]     Content-Type: text/plain
I0623 13:10:52.082368   35338 round_trippers.go:426]     Content-Length: 1057
I0623 13:10:52.082372   35338 round_trippers.go:426]     Date: Fri, 23 Jun 2017 18:10:52 GMT
::ffff:172.99.99.10 - [::ffff:172.99.99.10] - - [23/Jun/2017:18:10:37 +0000] "GET /logs/api/reporting/jobs/list_completed_since?since=2017-06-23T17:26:26.119Z HTTP/2.0" 200 262 "https://148.62.13.65/logs/app/monitoring" "Mozilla/5.0 (Macintosh; Intel Mac OS X 10.12; rv:45.0) Gecko/20100101 Firefox/45.0" 66 0.014 [kube-system-logs-5601] 10.2.0.3:5601 37 0.014 200"
::ffff:172.99.99.10 - [::ffff:172.99.99.10] - - [23/Jun/2017:18:10:46 +0000] "POST /logs/api/monitoring/v1/clusters HTTP/2.0" 200 973 "https://148.62.13.65/logs/app/monitoring" "Mozilla/5.0 (Macintosh; Intel Mac OS X 10.12; rv:45.0) Gecko/20100101 Firefox/45.0" 117 0.177 [kube-system-logs-5601] 10.2.0.3:5601 750 0.177 200"
::ffff:172.99.99.10 - [::ffff:172.99.99.10] - - [23/Jun/2017:18:10:47 +0000] "GET /logs/api/reporting/jobs/list_completed_since?since=2017-06-23T17:26:26.119Z HTTP/2.0" 200 262 "https://148.62.13.65/logs/app/monitoring" "Mozilla/5.0 (Macintosh; Intel Mac OS X 10.12; rv:45.0) Gecko/20100101 Firefox/45.0" 66 0.013 [kube-system-logs-5601] 10.2.0.3:5601 37 0.013 200"
- If the pod has been restarted previously, check the previous container’s logs with the
--previousflag.
$ kubectl describe po/etcd-operator-4083686351-rh6x7 -n kube-system | grep -A6 'State'
    State:    Running
      Started:    Fri, 23 Jun 2017 11:45:06 -0500
    Last State:   Terminated
      Reason:   Error
      Exit Code:  1
      Started:    Mon, 01 Jan 0001 00:00:00 +0000
      Finished:   Fri, 23 Jun 2017 11:45:05 -0500
    Ready:    True
    Restart Count:  1
$ kubectl logs --previous po/etcd-operator-4083686351-rh6x7 -n kube-system
time="2017-06-23T16:42:48Z" level=info msg="etcd-operator Version: 0.3.0"
time="2017-06-23T16:42:48Z" level=info msg="Git SHA: d976dc4"
time="2017-06-23T16:42:48Z" level=info msg="Go Version: go1.8.1"
time="2017-06-23T16:42:48Z" level=info msg="Go OS/Arch: linux/amd64"
time="2017-06-23T16:43:12Z" level=info msg="starts running from watch version: 0" pkg=controller
time="2017-06-23T16:43:12Z" level=info msg="start watching at 0" pkg=controller
time="2017-06-23T16:43:19Z" level=info msg="creating cluster with Spec (spec.ClusterSpec{Size:1, Version:\"3.1.6\", Paused:false, Pod:(*spec.PodPolicy)(0xc420240e40), Backup:(*spec.BackupPolicy)(nil), Restore:(*spec.RestorePolicy)(nil), SelfHosted:(*spec.SelfHostedPolicy)(0xc420116f70), TLS:(*spec.TLSPolicy)(nil)}), Status (spec.ClusterStatus{Phase:\"Creating\", Reason:\"\", ControlPaused:false, Conditions:[]spec.ClusterCondition(nil), Size:0, Members:spec.MembersStatus{Ready:[]string(nil), Unready:[]string(nil)}, CurrentVersion:\"\", TargetVersion:\"\", BackupServiceStatus:(*spec.BackupServiceStatus)(nil)})" cluster-name=kube-etcd pkg=cluster
time="2017-06-23T16:43:19Z" level=info msg="migrating boot member (http://10.3.0.200:12379)" cluster-name=kube-etcd pkg=cluster
time="2017-06-23T16:43:28Z" level=info msg="self-hosted cluster created with boot member (http://10.3.0.200:12379)" cluster-name=kube-etcd pkg=cluster
time="2017-06-23T16:43:28Z" level=info msg="wait 1m0s before removing the boot member" cluster-name=kube-etcd pkg=cluster
time="2017-06-23T16:43:28Z" level=info msg="start running..." cluster-name=kube-etcd pkg=cluster
time="2017-06-23T16:43:36Z" level=error msg="failed to update members: skipping update members for self hosted cluster: waiting for the boot member (boot-etcd) to be removed..." cluster-name=kube-etcd pkg=cluster
time="2017-06-23T16:43:44Z" level=error msg="failed to update members: skipping update members for self hosted cluster: waiting for the boot member (boot-etcd) to be removed..." cluster-name=kube-etcd pkg=cluster
time="2017-06-23T16:43:52Z" level=error msg="failed to update members: skipping update members for self hosted cluster: waiting for the boot member (boot-etcd) to be removed..." cluster-name=kube-etcd pkg=cluster
time="2017-06-23T16:44:00Z" level=error msg="failed to update members: skipping update members for self hosted cluster: waiting for the boot member (boot-etcd) to be removed..." cluster-name=kube-etcd pkg=cluster
time="2017-06-23T16:44:08Z" level=error msg="failed to update members: skipping update members for self hosted cluster: waiting for the boot member (boot-etcd) to be removed..." cluster-name=kube-etcd pkg=cluster
time="2017-06-23T16:44:16Z" level=error msg="failed to update members: skipping update members for self hosted cluster: waiting for the boot member (boot-etcd) to be removed..." cluster-name=kube-etcd pkg=cluster
time="2017-06-23T16:44:24Z" level=error msg="failed to update members: skipping update members for self hosted cluster: waiting for the boot member (boot-etcd) to be removed..." cluster-name=kube-etcd pkg=cluster
time="2017-06-23T16:44:35Z" level=info msg="Start reconciling" cluster-name=kube-etcd pkg=cluster
time="2017-06-23T16:44:35Z" level=info msg="Finish reconciling" cluster-name=kube-etcd pkg=cluster
E0623 16:44:36.200993       1 election.go:259] Failed to update lock: etcdserver: request timed out, possibly due to previous leader failure
time="2017-06-23T16:44:43Z" level=info msg="Start reconciling" cluster-name=kube-etcd pkg=cluster
time="2017-06-23T16:44:43Z" level=info msg="Finish reconciling" cluster-name=kube-etcd pkg=cluster
time="2017-06-23T16:44:51Z" level=info msg="Start reconciling" cluster-name=kube-etcd pkg=cluster
time="2017-06-23T16:44:51Z" level=info msg="Finish reconciling" cluster-name=kube-etcd pkg=cluster
time="2017-06-23T16:44:59Z" level=info msg="Start reconciling" cluster-name=kube-etcd pkg=cluster
time="2017-06-23T16:44:59Z" level=info msg="Finish reconciling" cluster-name=kube-etcd pkg=cluster
time="2017-06-23T16:45:05Z" level=error msg="received invalid event from API server: fail to decode raw event from apiserver (unexpected EOF)" pkg=controller
time="2017-06-23T16:45:05Z" level=fatal msg="controller Run() ended with failure: fail to decode raw event from apiserver (unexpected EOF)"
Attach to a pod
You can attach to a pod for troubleshooting purposes. However, do not make changes or fix issues through attaching. If a pod is not working as intended, investigate the image, YAML configuration file, or system needs.
- Run
/bin/bashfrom the NGINX pod:
$ kubectl -n rackspace-system exec -it nginx-ingress-controller-294216488-ncfq9 -- /bin/bash
- If
bashfails, trysh:
$ kubectl -n rackspace-system exec -it nginx-ingress-controller-294216488-ncfq9 -- sh`
Now you can perform a few simple operations wit. the pod.
- View the list of directories and files:
root@shanec-cluster-worker-1:/# ls -la /
total 26936
drwxr-xr-x.   1 root root     4096 Jun 23 16:45 .
drwxr-xr-x.   1 root root     4096 Jun 23 16:45 ..
-rwxr-xr-x.   1 root root        0 Jun 23 16:45 .dockerenv
-rw-r-----.   2 root root     1194 Feb 22 17:39 Dockerfile
drwxr-xr-x.   2 root root     4096 Jun 23 16:45 bin
drwxr-xr-x.   2 root root     4096 Apr 12  2016 boot
drwxr-xr-x.   5 root root      380 Jun 23 16:45 dev
drwxr-xr-x.   1 root root     4096 Jun 23 16:45 etc
drwxr-xr-x.   2 root root     4096 Apr 12  2016 home
drwxr-x---.   1 root root     4096 Jun 23 16:45 ingress-controller
drwxr-xr-x.   5 root root     4096 Jun 23 16:45 lib
drwxr-xr-x.   2 root root     4096 Jun 23 16:45 lib64
drwxr-xr-x.   2 root root     4096 Jan 19 16:31 media
drwxr-xr-x.   2 root root     4096 Jan 19 16:31 mnt
-rwxr-x---.   2 root root 27410080 Mar 14 21:46 nginx-ingress-controller
drwxr-xr-x.   2 root root     4096 Jan 19 16:31 opt
dr-xr-xr-x. 126 root root        0 Jun 23 16:45 proc
drwx------.   1 root root     4096 Jun 24 23:30 root
drwxr-xr-x.   1 root root     4096 Jun 23 16:45 run
drwxr-xr-x.   2 root root     4096 Mar 14 21:46 sbin
drwxr-xr-x.   2 root root     4096 Jan 19 16:31 srv
dr-xr-xr-x.  13 root root        0 Jun 23 16:39 sys
drwxrwxrwt.   1 root root     4096 Jun 24 23:30 tmp
drwxr-xr-x.  10 root root     4096 Jun 23 16:45 usr
drwxr-xr-x.   1 root root     4096 Jun 23 16:45 var
- Display the information about disk space:
root@shanec-cluster-worker-1:/# df -h
Filesystem      Size  Used Avail Use% Mounted on
overlay          95G  3.2G   88G   4% /
tmpfs           2.0G     0  2.0G   0% /dev
tmpfs           2.0G     0  2.0G   0% /sys/fs/cgroup
/dev/vda9        95G  3.2G   88G   4% /etc/hosts
shm              64M     0   64M   0% /dev/shm
tmpfs           2.0G   12K  2.0G   1% /run/secrets/kubernetes.io/serviceaccount
- Display the information about the Linux distribution:
root@shanec-cluster-worker-1:/# cat /etc/lsb-release
DISTRIB_ID=Ubuntu
DISTRIB_RELEASE=16.04
DISTRIB_CODENAME=xenial
DISTRIB_DESCRIPTION="Ubuntu 16.04.2 LTS"
Run single commands
You can run single commands to perform operations with pods:
$ kubectl -n kube-system exec nginx-ingress-controller-294216488-ncfq9 ls /var/log/nginx
access.log
error.log
Check the running configuration
When troubleshooting a Kubernetes cluster, you might want to check the YAML configuration file that the deployment uses.
To check the deployment YAML file, run the following command:
$ kubectl get deploy/kibana -o yaml -n rackspace-system > deployment-kibana.yaml
System response:
$ cat deployment-kibana.yaml
apiVersion: extensions/v1beta1
kind: Deployment
metadata:
  annotations:
    deployment.kubernetes.io/revision: "1"
    kubectl.kubernetes.io/last-applied-configuration: |
      {"apiVersion":"extensions/v1beta1","kind":"Deployment","metadata":{"annotations":{},"labels":{"k8s-app":"kibana"},"name":"kibana","namespace":"kube-system"},"spec":{"replicas":1,"template":{"metadata":{"labels":{"k8s-app":"kibana"}},"spec":{"affinity":{"podAntiAffinity":{"requiredDuringSchedulingIgnoredDuringExecution":[{"labelSelector":{"matchExpressions":[{"key":"k8s-app","operator":"In","values":["kibana"]}]},"topologyKey":"kubernetes.io/hostname"}]}},"containers":[{"env":[{"name":"ELASTICSEARCH_URL","value":"http://elasticsearch-logging:9200"},{"name":"SERVER_BASEPATH","value":"/logs"}],"image":"docker.elastic.co/kibana/kibana:5.3.0","name":"kibana","ports":[{"containerPort":5601,"name":"ui","protocol":"TCP"}],"readinessProbe":{"httpGet":{"path":"/api/status","port":5601},"initialDelaySeconds":90,"periodSeconds":60},"resources":{"requests":{"cpu":"100m"}}}]}}}}
  creationTimestamp: 2017-06-23T16:44:37Z
  generation: 1
  labels:
    k8s-app: kibana
  name: kibana
  namespace: rackspace-system
  resourceVersion: "2595"
  selfLink: /apis/extensions/v1beta1/namespaces/kube-system/deployments/kibana
  uid: 3ec4a8d0-5833-11e7-acfc-fa163e1f6ecf
spec:
  replicas: 1
  selector:
    matchLabels:
      k8s-app: kibana
  strategy:
    rollingUpdate:
      maxSurge: 1
      maxUnavailable: 1
    type: RollingUpdate
  template:
    metadata:
      creationTimestamp: null
      labels:
        k8s-app: kibana
    spec:
      affinity:
        podAntiAffinity:
          requiredDuringSchedulingIgnoredDuringExecution:
          - labelSelector:
              matchExpressions:
              - key: k8s-app
                operator: In
                values:
                - kibana
            topologyKey: kubernetes.io/hostname
      containers:
      - env:
        - name: ELASTICSEARCH_URL
          value: http://elasticsearch-logging:9200
        - name: SERVER_BASEPATH
          value: /logs
        image: docker.elastic.co/kibana/kibana:5.3.0
        imagePullPolicy: IfNotPresent
        name: kibana
        ports:
        - containerPort: 5601
          name: ui
          protocol: TCP
        readinessProbe:
          failureThreshold: 3
          httpGet:
            path: /api/status
            port: 5601
            scheme: HTTP
          initialDelaySeconds: 90
          periodSeconds: 60
          successThreshold: 1
          timeoutSeconds: 1
        resources:
          requests:
            cpu: 100m
        terminationMessagePath: /dev/termination-log
        terminationMessagePolicy: File
      dnsPolicy: ClusterFirst
      restartPolicy: Always
      schedulerName: default-scheduler
      securityContext: {}
      terminationGracePeriodSeconds: 30
status:
  availableReplicas: 1
  conditions:
  - lastTransitionTime: 2017-06-23T16:44:56Z
    lastUpdateTime: 2017-06-23T16:44:56Z
    message: Deployment has minimum availability.
    reason: MinimumReplicasAvailable
    status: "True"
    type: Available
  observedGeneration: 1
  readyReplicas: 1
  replicas: 1
  updatedReplicas: 1
Namespaces
Kubernetes uses namespaces to isolate Kubernetes resources from each other and manage access control. Namespaces are virtual clusters that provide scope for names and cluster resource management. When you run a command, you need to specify in which namespace a resource is located.
By default, Rackspace KaaS has the following Kubernetes namespaces:
- default
- kube-public
- kube-system
- monitoring
- rackspace-system
- tectonic-system
You can use the following commands to get information about Kubernetes namespaces:
- Get the list of namespaces:
 $ kubectl get namespace
NAME               STATUS    AGE
default            Active    15h
kube-public        Active    15h
kube-system        Active    15h
monitoring         Active    15h
rackspace-system   Active    15h
tectonic-system    Active    15h
- Get the list of pods:
$ kubectl get pods
No resources found.
- Get the list of pods for the
kube-systemnamespace:
$ kubectl get pods -n kube-system
NAME                                             READY     STATUS    RESTARTS   AGE
default-http-backend-2198840601-phqnn            1/1       Running   0          1d
elasticsearch-3003189550-91mvh                   1/1       Running   0          1d
elasticsearch-3003189550-l3gds                   1/1       Running   0          1d
elasticsearch-3003189550-pz8zn                   1/1       Running   0          1d
etcd-operator-4083686351-rh6x7                   1/1       Running   1          1d
...
Failure domains
The following list describes significant failure domains and issues in a Kubernetes cluster deployment:
- etcd
- Susceptible to network latency
- Maintain 50%+1 availabity (will go read-only if fall below threshold)
- Controller manager and scheduler
- Controller manager fails: cloud provider integrations, such as neutron LBaaS stop working.
- Controller manager and scheduler fail: Deployments and so on cannot scale. Failed node workloads do not reschedule.
Troubleshooting unresponsive Kubernetes services
This section describes troubleshooting tasks for Rackapace KaaS managed services.
kube-scheduler
Kubernetes scheduler plays an important role in ensuring Kubernetes resource availability and performance. Verifying that Kubernetes scheduler is operational is one of the essential steps of cluster troubleshooting.
No scheduler pods available
When a Kubernetes service is unavailable, you can use kube-scheduler to troubleshoot the problem. To simulate a scenario where no scheduler pods are available, scale the deployment to zero replicas so that Kubernetes cannot schedule or reschedule any additional pods.
Note: You can use this method with other services, such as kube-controller-manager.
To troubleshoot an unavailable Kubernetes service, complete the following steps:
- List all
kube-schedulerresources in thekube-systemnamespace:
 $ kubectl get all -l k8s-app=kube-scheduler -n kube-system
   NAME                    DESIRED   CURRENT   UP-TO-DATE   AVAILABLE   AGE
   deploy/kube-scheduler   3         3         3            3           2d

   NAME                           DESIRED   CURRENT   READY     AGE
   rs/kube-scheduler-774c4578b7   3         3         3         2d

   NAME                    DESIRED   CURRENT   UP-TO-DATE   AVAILABLE   AGE
   deploy/kube-scheduler   3         3         3            3           2d

   NAME                           DESIRED   CURRENT   READY     AGE
   rs/kube-scheduler-774c4578b7   3         3         3         2d

   NAME                                 READY     STATUS    RESTARTS   AGE
   po/kube-scheduler-774c4578b7-jrd9s   1/1       Running   0          2d
   po/kube-scheduler-774c4578b7-jtqcl   1/1       Running   0          2d
   po/kube-scheduler-774c4578b7-nprqb   1/1       Running   0          2d

   NAME                                      TYPE        CLUSTER-IP   EXTERNAL-IP   PORT(S)     AGE
   svc/kube-scheduler-prometheus-discovery   ClusterIP   None         <none>        10251/TCP   2d
- Scale
kube-schedulerto zero replicas:
$ kubectl scale deploy kube-scheduler --replicas 0 -n kube-system
deployment "kube-scheduler" scaled
- List all resources for
kube-scheduler:
$ kubectl get all -l k8s-app=kube-scheduler -n kube-system
NAME                    DESIRED   CURRENT   UP-TO-DATE   AVAILABLE   AGE
deploy/kube-scheduler   0         0         0            0           2d

NAME                           DESIRED   CURRENT   READY     AGE
rs/kube-scheduler-774c4578b7   0         0         0         2d

NAME                    DESIRED   CURRENT   UP-TO-DATE   AVAILABLE   AGE
deploy/kube-scheduler   0         0         0            0           2d

NAME                           DESIRED   CURRENT   READY     AGE
rs/kube-scheduler-774c4578b7   0         0         0         2d

NAME                                      TYPE        CLUSTER-IP   EXTERNAL-IP   PORT(S)     AGE
svc/kube-scheduler-prometheus-discovery   ClusterIP   None         <none>        10251/TCP   2d
Kubernetes scheduler is now unavailable. To fix this you can act as a scheduler.
- Save the
kube-schedulerconfiguration in a*.yamlfile:
kubectl get deploy kube-scheduler -n kube-system -o yaml > scheduler.yaml
- View the
scheduler.yamlfile:
$ cat scheduler.yaml

  apiVersion: extensions/v1beta1
  kind: Deployment
  metadata:
    annotations:
      deployment.kubernetes.io/revision: "1"
    creationTimestamp: 2017-10-04T18:52:20Z
    generation: 2
    labels:
      k8s-app: kube-scheduler
      tectonic-operators.coreos.com/managed-by: kube-version-operator
      tier: control-plane
    name: kube-scheduler
    namespace: kube-system
    resourceVersion: "413557"
    selfLink: /apis/extensions/v1beta1/namespaces/kube-system/deployments/kube-scheduler
    uid: 26cb400d-a935-11e7-9e40-fa163ece5424
  spec:
    replicas: 0
    selector:
      matchLabels:
        k8s-app: kube-scheduler
        tier: control-plane
  strategy:
    rollingUpdate:
      maxSurge: 1
      maxUnavailable: 0
    type: RollingUpdate
  template:
    metadata:
      annotations:
        scheduler.alpha.kubernetes.io/critical-pod: ""
      creationTimestamp: null
      labels:
        k8s-app: kube-scheduler
        pod-anti-affinity: kube-scheduler-1.7.5-tectonic.1
        tectonic-operators.coreos.com/managed-by: kube-version-operator
        tier: control-plane
  spec:
    affinity:
      podAntiAffinity:
        requiredDuringSchedulingIgnoredDuringExecution:
        - labelSelector:
            matchLabels:
              pod-anti-affinity: kube-scheduler-1.7.5-tectonic.1
          namespaces:
          - kube-system
          topologyKey: kubernetes.io/hostname
    containers:
    - command:
      - ./hyperkube
      - scheduler
      - --leader-elect=true
      image: quay.io/coreos/hyperkube:v1.8.0_coreos.0
      imagePullPolicy: IfNotPresent
      livenessProbe:
        failureThreshold: 3
        httpGet:
          path: /healthz
          port: 10251
          scheme: HTTP
        initialDelaySeconds: 15
        periodSeconds: 10
        successThreshold: 1
        timeoutSeconds: 15
      name: kube-scheduler
      resources: {}
      terminationMessagePath: /dev/termination-log
      terminationMessagePolicy: File
    dnsPolicy: ClusterFirst
    nodeSelector:
      node-role.kubernetes.io/master: ""
    restartPolicy: Always
    schedulerName: default-scheduler
    securityContext:
      runAsNonRoot: true
      runAsUser: 65534
    terminationGracePeriodSeconds: 30
    tolerations:
    - key: CriticalAddonsOnly
      operator: Exists
    - effect: NoSchedule
      key: node-role.kubernetes.io/master
      operator: Exists
  status:
    conditions:
    - lastTransitionTime: 2017-10-04T18:53:34Z
      lastUpdateTime: 2017-10-04T18:53:34Z
      message: Deployment has minimum availability.
      reason: MinimumReplicasAvailable
      status: "True"
      type: Available
  observedGeneration: 2
- Change the kind of resource from
DeploymenttoPod, addnodeNamewhich must be one of the Kubernetes master nodes, and remove all the unnecessary parameters:
$ cat scheduler.yaml

apiVersion: v1
kind: Pod
metadata:
  labels:
    k8s-app: kube-scheduler
    tectonic-operators.coreos.com/managed-by: kube-version-operator
    tier: control-plane
  name: kube-scheduler
  namespace: kube-system
  uid: 26cb400d-a935-11e7-9e40-fa163ece5424
spec:
  nodeName: test-cluster-master-0
  containers:
  - command:
    - ./hyperkube
    - scheduler
    - --leader-elect=true
    image: quay.io/coreos/hyperkube:v1.8.0_coreos.0
    imagePullPolicy: IfNotPresent
    livenessProbe:
      failureThreshold: 3
      httpGet:
        path: /healthz
        port: 10251
        scheme: HTTP
      initialDelaySeconds: 15
      periodSeconds: 10
      successThreshold: 1
      timeoutSeconds: 15
    name: kube-scheduler
    resources: {}
    terminationMessagePath: /dev/termination-log
    terminationMessagePolicy: File
  dnsPolicy: ClusterFirst
  nodeSelector:
    node-role.kubernetes.io/master: ""
  restartPolicy: Always
  schedulerName: default-scheduler
  securityContext:
    runAsNonRoot: true
    runAsUser: 65534
  terminationGracePeriodSeconds: 30
  tolerations:
  - key: CriticalAddonsOnly
    operator: Exists
  - effect: NoSchedule
    key: node-role.kubernetes.io/master
    operator: Exists
- Create the
schedulerpod from the .yaml file:
$ kubectl create -f scheduler.yaml
pod "kube-scheduler" created
- Verify that the pod is running:
$ kubectl get all -l k8s-app=kube-scheduler -n kube-system
NAME                    DESIRED   CURRENT   UP-TO-DATE   AVAILABLE   AGE
deploy/kube-scheduler   0         0         0            0           2d

NAME                           DESIRED   CURRENT   READY     AGE
rs/kube-scheduler-774c4578b7   0         0         0         2d

NAME                    DESIRED   CURRENT   UP-TO-DATE   AVAILABLE   AGE
deploy/kube-scheduler   0         0         0            0           2d

NAME                           DESIRED   CURRENT   READY     AGE
rs/kube-scheduler-774c4578b7   0         0         0         2d

NAME                READY     STATUS    RESTARTS   AGE
po/kube-scheduler   1/1       Running   0          18s

NAME                                      TYPE        CLUSTER-IP   EXTERNAL-IP   PORT(S)     AGE
svc/kube-scheduler-prometheus-discovery   ClusterIP   None         <none>        10251/TCP   2d
- Scale the
kube-schedulerpod back to three replicas:
$ kubectl scale deploy kube-scheduler --replicas 3 -n kube-system
deployment "kube-scheduler" scaled

$ kubectl get all -l k8s-app=kube-scheduler -n kube-system
NAME                    DESIRED   CURRENT   UP-TO-DATE   AVAILABLE   AGE
deploy/kube-scheduler   3         3         3            3           2d

NAME                           DESIRED   CURRENT   READY     AGE
rs/kube-scheduler-774c4578b7   3         3         3         2d

NAME                    DESIRED   CURRENT   UP-TO-DATE   AVAILABLE   AGE
deploy/kube-scheduler   3         3         3            3           2d

NAME                           DESIRED   CURRENT   READY     AGE
rs/kube-scheduler-774c4578b7   3         3         3         2d

NAME                                 READY     STATUS    RESTARTS   AGE
po/kube-scheduler                    1/1       Running   0          3m
po/kube-scheduler-774c4578b7-kdjq7   1/1       Running   0          20s
po/kube-scheduler-774c4578b7-s5khx   1/1       Running   0          20s
po/kube-scheduler-774c4578b7-zqmlc   1/1       Running   0          20s

NAME                                      TYPE        CLUSTER-IP   EXTERNAL-IP   PORT(S)     AGE
svc/kube-scheduler-prometheus-discovery   ClusterIP   None         <none>        10251/TCP   2d

10.
- Delete the standalone pod.
 $ kubectl delete -f scheduler.yaml
   pod "kube-scheduler" deleted
Persistance volume claims
Re-attach a cinder volume to a Kubernetes worker node
When Kubernetes reschedules a pod to a different worker node, a cinder volume might fail to properly detach and re-attach to the new Kubernetes worker node. In this case, you can detach and re-attach the cinder volume manually to the correct Kubernetes worker node. However, after detaching the cinder volume from the old worker node and attaching it to the proper node with the pod on it, the pod was still unable to mount the required volume. The worker node logged the following information:
Apr 19 19:29:35 kubernetes-worker-2 kubelet-wrapper[3486]: E0419 19:29:35.648597    3486 cinder_util.go:231] error running udevadm trigger executable file not found in $PATH
Apr 19 19:29:35 kubernetes-worker-2 kubelet-wrapper[3486]: W0419 19:29:35.662610    3486 openstack_volumes.go:530] Failed to find device for the volumeID: "f30a02e0-3f1d-4b72-8780-89fcb7f607e2"
Apr 19 19:29:35 kubernetes-worker-2 kubelet-wrapper[3486]: E0419 19:29:35.662656    3486 attacher.go:257] Error: could not find attached Cinder disk "f30a02e0-3f1d-4b72-8780-89fcb7f607e2" (path: ""): <nil>
The cinder volume was properly attached.
kubernetes-worker-2 ~ # lsblk

...

`-vda9  253:9    0 37.7G  0 part  /
vdb     253:16   0    1G  0 disk  /var/lib/rkt/pods/run/e38e20c6-5079-4963-a903-16eac5f78cc4/stage1/rootfs/opt/stage2/hyperkube/rootfs/var/lib/kubelet/pods/ccc7835f-3c5a-11e8-aa40-fa163e75f19c/volumes/kubernetes.io~cinder/pvc-ed6ce616-
vdc     253:32   0    5G  0 disk  /var/lib/rkt/pods/run/e38e20c6-5079-4963-a903-16eac5f78cc4/stage1/rootfs/opt/stage2/hyperkube/rootfs/var/lib/kubelet/pods/bbf8206d-3d26-11e8-a1f7-fa163e9d3696/volumes/kubernetes.io~cinder/pvc-f784e495-
vdd     253:48   0   10G  0 disk
However, it did not appear in /dev/disk/by-id.
kubernetes-worker-2 ~ # ls -la /dev/disk/by-id/
total 0
drwxr-xr-x. 2 root root 140 Apr 11 01:27 .
drwxr-xr-x. 9 root root 180 Apr 11 01:23 ..
lrwxrwxrwx. 1 root root  10 Apr 11 01:24 dm-name-usr -> ../../dm-0
lrwxrwxrwx. 1 root root  10 Apr 11 01:24 dm-uuid-CRYPT-VERITY-81303a5145884861ba3eed4159b13a6e-usr -> ../../dm-0
lrwxrwxrwx. 1 root root  10 Apr 11 01:24 raid-usr -> ../../dm-0
lrwxrwxrwx. 1 root root   9 Apr 11 01:26 virtio-00b864b6-4e42-4447-8 -> ../../vdb
lrwxrwxrwx. 1 root root   9 Apr 11 01:27 virtio-7dbdb566-7da1-4ffd-a -> ../../vdc
It appeared in /dev/disk/by-path/.
kubernetes-worker-2 ~ # ls -la /dev/disk/by-path/
total 0

...

lrwxrwxrwx. 1 root root   9 Apr 11 01:26 virtio-pci-0000:00:0e.0 -> ../../vdb
lrwxrwxrwx. 1 root root   9 Apr 11 01:27 virtio-pci-0000:00:0f.0 -> ../../vdc
lrwxrwxrwx. 1 root root   9 Apr 19 18:19 virtio-pci-0000:00:10.0 -> ../../vdd
A search returned the following from the worker node.
kubernetes-worker-2 ~ # udevadm trigger
After that, vdd recovered and the pod was able to attach the volume and start properly.
kubernetes-worker-2 ~ # ls -la /dev/disk/by-id/
total 0
drwxr-xr-x. 2 root root 160 Apr 19 19:47 .
drwxr-xr-x. 9 root root 180 Apr 11 01:23 ..
lrwxrwxrwx. 1 root root  10 Apr 19 19:47 dm-name-usr -> ../../dm-0
lrwxrwxrwx. 1 root root  10 Apr 19 19:47 dm-uuid-CRYPT-VERITY-81303a5145884861ba3eed4159b13a6e-usr -> ../../dm-0
lrwxrwxrwx. 1 root root  10 Apr 19 19:47 raid-usr -> ../../dm-0
lrwxrwxrwx. 1 root root   9 Apr 19 19:47 virtio-00b864b6-4e42-4447-8 -> ../../vdb
lrwxrwxrwx. 1 root root   9 Apr 19 19:47 virtio-7dbdb566-7da1-4ffd-a -> ../../vdc
lrwxrwxrwx. 1 root root   9 Apr 19 19:47 virtio-f30a02e0-3f1d-4b72-8 -> ../../vdd
Troubleshooting etcd
etcd is a highly-available distributed key-value store for Kubernetes and one of the most critical components of Rackspace KaaS that requires maintenance. The process of etcd backup, restoration, and scaling is currently being developed.
For more information about etcd, see:
- https://coreos.com/etcd/docs/latest/
- https://raft.github.io/
- https://github.com/kubernetes/kubernetes/tree/master/vendor/github.com/coreos/etcd/raft
Check the etcd cluster health manually
- Connect to the etcd node using SSH.
- Check the cluster health information using
etcdctl:
etcdctl --ca-file=/opt/tectonic/tls/etcd-client-ca.crt --cert-file=/opt/tectonic/tls/etcd-client.crt --key-file=/opt/tectonic/tls/etcd-client.key --endpoints=https://etcd-0.<domain-name>:2379,https://etcd-1.<domain-name>:2379,https://etcd-2.<domain-name>:2379 cluster-health
View the etcd data directory
The etcd data directory stores the information about etcd configuration in a write-ahead log (WAL). The data directory has the following subdirectories:
snapstores snapshots of the log files.walstores the write-ahead log files.
To view the contents of the snap and wal subdirectories for a selected pod, run the following command:
$ kubectl -n kube-system exec -it kube-etcd-0000 -- ls -lah /var/etcd/kube-system-kube-etcd-0000/member/{snap,wal}
System response:
/var/etcd/kube-system-kube-etcd-0000/member/snap:
total 5136
drwx------    2 root     root        4.0K Jun 25 15:35 .
drwx------    4 root     root        4.0K Jun 25 15:35 ..
-rw-------    1 root     root       16.0M Jun 25 15:57 db

/var/etcd/kube-system-kube-etcd-0000/member/wal:
total 125024
drwx------    2 root     root        4.0K Jun 25 15:35 .
drwx------    4 root     root        4.0K Jun 25 15:35 ..
-rw-------    1 root     root       61.0M Jun 25 15:35 0.tmp
-rw-------    1 root     root       61.0M Jun 25 15:57 0000000000000000-0000000000000000.wal
Troubleshooting octavia
OpenStack octavia is a load balancer that ensures even workload distribution among Kubernetes worker nodes. This section describes common issues with octavia that runs on top of Rackspace Private Cloud Powered by OpenStack (RPCO) for the Rackspace Kubernetes-as-a-Service (KaaS) solution.
Identify the load balancer that backs a public IP address
Typically, a Rackspace KaaS deployment manages load balancer (LB) instances for the Kubernetes API, the Ingress Controller, and the Docker registry. Each instance has a DNS name associated with it that has the following naming conventions:
- The Kubernetes API instance -
*``k8s.my.domain - The Ingress Controller instance -
kibana.my.domain - The Docker registry instance -
registry.my.domain
To identify which load balancer is associated with a public floating IP address (FIP) for the Kubernetes cluster, perform the following steps:
- Find the public FIP address based on the DNS name.
- Find the fixed IP address associated with the public FIP address in the output of the following command:
openstack floating ip list --project <cluster-project-id>
- View the list of the deployed load balancers:
openstack loadbalancer list --project <cluster-project-id>
The fixed IP address from the previous step matches the vip_address of the load balancer that backs the public IP.
Example:
$ ping kibana.my-subdomain.mk8s.systems
  PING kibana.my-subdomain.mk8s.systems (172.99.77.50)

$ openstack floating ip list --project 2638a6bef56e4b63a45b1b6a837e5c0e

+--------------------------------------+---------------------+------------------+--------------------------------------+--------------------------------------+----------------------------------+
| ID                                   | Floating IP Address | Fixed IP Address | Port                                 | Floating Network                     | Project                          |
+--------------------------------------+---------------------+------------------+--------------------------------------+--------------------------------------+----------------------------------+
| 1546003c-d081-4ca0-a015-3f6654966341 | 172.99.77.25        | 10.0.0.10        | c7f160e7-cd46-4ef7-ae1d-b94bb429ce03 | 2c7b3798-d48d-4b35-b915-51d28f5ffeb8 | 2638a6bef56e4b63a45b1b6a837e5c0e |
| 476ad4ff-6798-4d79-b7c4-22b10bdec987 | 172.99.77.50        | 10.0.0.9         | 9bd6bf8e-52db-437b-81b3-acf374e45f46 | 2c7b3798-d48d-4b35-b915-51d28f5ffeb8 | 2638a6bef56e4b63a45b1b6a837e5c0e |
| 4ef044fb-56db-46b9-8c0f-13b22a015de4 | 172.99.77.185       | 10.242.0.33      | 7530546e-aec9-42e2-a11e-dc09fbba5538 | 2c7b3798-d48d-4b35-b915-51d28f5ffeb8 | 2638a6bef56e4b63a45b1b6a837e5c0e |
| 61644afa-4283-4460-be7c-0025a03f0483 | 172.99.77.92        | 10.0.0.35        | 9464e8f0-56aa-4e3a-979e-a61190bb05b3 | 2c7b3798-d48d-4b35-b915-51d28f5ffeb8 | 2638a6bef56e4b63a45b1b6a837e5c0e |
| 9629a3eb-503e-4792-a4ba-f849d43d77d7 | 172.99.77.127       | 10.0.0.8         | fcf93e0b-1093-4b19-a021-10ba4668d094 | 2c7b3798-d48d-4b35-b915-51d28f5ffeb8 | 2638a6bef56e4b63a45b1b6a837e5c0e |
| c3167915-cf05-4ddd-ad78-ed60ee495c0c | 172.99.77.157       | 10.242.0.21      | eb3181d4-821b-49ca-8583-02431f7d22db | 2c7b3798-d48d-4b35-b915-51d28f5ffeb8 | 2638a6bef56e4b63a45b1b6a837e5c0e |
| d4c1b009-7b1c-459c-abd8-57effc1f28e9 | 172.99.77.187       | 10.0.0.22        | f1801ceb-c5d9-4e8a-bbcf-e54d31f25e6f | 2c7b3798-d48d-4b35-b915-51d28f5ffeb8 | 2638a6bef56e4b63a45b1b6a837e5c0e |
| dc92e666-2892-4072-ab47-2bfdef886b3c | 172.99.77.201       | 10.0.0.19        | f1077048-de22-4890-ba85-21a6eb973a1c | 2c7b3798-d48d-4b35-b915-51d28f5ffeb8 | 2638a6bef56e4b63a45b1b6a837e5c0e |
+--------------------------------------+---------------------+------------------+--------------------------------------+--------------------------------------+----------------------------------+

$ openstack loadbalancer list

+--------------------------------------+----------------------------------+----------------------------------+-------------+---------------------+----------+
| id                                   | name                             | project_id                       | vip_address | provisioning_status | provider |
+--------------------------------------+----------------------------------+----------------------------------+-------------+---------------------+----------+
| b413a684-e166-41d7-814e-4ccf3b9a8945 | a51c6689f3f3a11e88bd2fa163e8c31c | 2638a6bef56e4b63a45b1b6a837e5c0e | 10.0.0.23   | ACTIVE              | octavia  |
| 46ac026b-1138-44b6-9a23-751fcbd609bd | a791cadb1424611e8bda8fa163e8c31c | 2638a6bef56e4b63a45b1b6a837e5c0e | 10.0.0.35   | ACTIVE              | octavia  |
| 2ae6615f-67ba-4fd7-a06e-c7959fe7b748 | k8s-terraform_master             | 2638a6bef56e4b63a45b1b6a837e5c0e | 10.0.0.22   | ACTIVE              | octavia  |
| 6a892fe7-9fb3-4601-bb9c-0b50dc363a18 | a595a2faa428f11e89e3cfa163eba020 | 2638a6bef56e4b63a45b1b6a837e5c0e | 10.0.0.9    | ACTIVE              | octavia  |
+--------------------------------------+----------------------------------+----------------------------------+-------------+---------------------+----------+
In the example above, the load balancer ID is 6a892fe7-9fb3-4601-bb9c-0b50dc363a18.
Check the load balancer status
Use the following command to check the operating health of a load balancer:
openstack loadbalancer show <load-balancer-id>
Octavia load balancers have the following status fields that indicate the status of the deployment:
-
provisioning_statusThe
provisioning_statusfield indicates the status of the most recent action taken against the load balancer deployment. This includes such actions as deployment of a new LB instance or automatic replacement of an LB worker (amphora).If the
provisioning_statusof the load balancer displaysERROR, an underlying issue might be present that is preventing octavia from updating the load balancer deployment. Check the octavia logs on the OpenStack infrastructure nodes of the underlying cloud to determine the issue. After you resolve the issue, replace the load balancer as described in Replacing a Load Balancer.Note
The
ERRORstatus does not always mean that the load balancer cannot serve network traffic. It might indicate a problem with a change in the deployment configuration, not an operational malfunction. However, it implies a problem with the self-healing capabilities of the load balancer. -
operating_statusThe
operating_statusfield indicates the observed status of the deployment through the health monitor. If theoperating_statushas any status other thanONLINE, this might indicate one of the following issues:- An issue with a service behind the load balancer or the service’s health monitor. Verify that the servers and services behind the load balancer are up and can respond to the network traffic.
- An issue with the load balancer that requires replacement of the load balancer instance. Typically, if
provisioning_statusof the load balancer is different fromERROR, the octavia health monitor resolves this issue automatically by failing over and replacing the amphora worker that is experiencing the issue. If the issue persists, and the octavia deployment cannot process the traffic, you might need to replace the load balancer instance as described in Replacing a Load Balancer.
Cannot delete a load balancer deployment
A load balancer deployment might change its status from PENDING_DELETE to ERROR during the deletion and fail to delete. Typically, this happens when OpenStack fails to delete one or more neutron ports. In some cases, re-running the delete command is enough to fix the issue, while in other cases, you might need to find the associated network, manually delete it, and then delete the octavia balancer using the openstack loadbalancer delete command.
To identify and correct this issue, perform the following steps:
- Re-run the load balancer deletion command:
openstack loadbalancer delete --cascade <load balancer id>
In some cases, the load balancer deletion opera. ion fails because of slow port deletion.
- Check the
octavia_workerlogs on each OpenStack infrastructure node to find which worker instance processed the deletion of the load balancer. - Log in to the OpenStack infrastructure node.
- Run the following command:
root@543230-infra01:/opt/rpc-openstack/openstack-ansible# ansible os-infra_hosts -m shell -a "grep '52034239-a49d-41a9-a58d-7b2b880b98f7' /openstack/og/*octavia*/octavia/octavia-worker.log
System response:
...
543230-infra02 | OK | rc=0 >>
2018-04-16 14:18:35.580 14274 INFO octavia.controller.queue.endpoint [-] Deleting load balancer '52034239-a49d-41a9-a58d-7b2b880b98f7'...
2018-04-16 14:18:39.882 14274 INFO octavia.network.drivers.neutron.allowed_address_pairs [-] Removing security group 5af1ea07-141b-46c7-8b64-8a65e0f7a6ab from port c6dbdd75-cce1-4101-8235-3155b08df809
The output above indicates that the octavia worker on the infra02 node successfully completed the deletion operation.
- On the
infra02host, search for the messages following the deletion of the load balancing instance in/openstack/log/*octavia*/octavia/octavia-worker.log.
Example:
2018-04-16 14:18:35.580 14274 INFO octavia.controller.queue.endpoint [-] Deleting load balancer '52034239-a49d-41a9-a58d-7b2b880b98f7'...
2018-04-16 14:18:39.882 14274 INFO octavia.network.drivers.neutron.allowed_address_pairs [-] Removing security group 5af1ea07-141b-46c7-8b64-8a65e0f7a6ab from port c6dbdd75-cce1-4101-8235-3155b08df809
2018-04-16 14:18:40.653 14274 WARNING octavia.network.drivers.neutron.allowed_address_pairs [-] Attempt 1 to remove security group 5af1ea07-141b-46c7-8b64-8a65e0f7a6ab failed.: Conflict: Security Group 5af1ea07-141b-46c7-8b64-8a65e0f7a6ab in use.
Neutron server returns request_ids: ['req-8b369249-733f-4728-9e3a-8474e8829562']
2018-04-16 14:18:41.765 14274 WARNING octavia.network.drivers.neutron.allowed_address_pairs [-] Attempt 2 to remove security group 5af1ea07-141b-46c7-8b64-8a65e0f7a6ab failed.: Conflict: Security Group 5af1ea07-141b-46c7-8b64-8a65e0f7a6ab in use.
Neutron server returns request_ids: ['req-a3eceff7-a416-4a1f-aa0c-db1cb0daf9a9']
2018-04-16 14:18:42.833 14274 WARNING octavia.network.drivers.neutron.allowed_address_pairs [-] Attempt 3 to remove security group 5af1ea07-141b-46c7-8b64-8a65e0f7a6ab failed.: Conflict: Security Group 5af1ea07-141b-46c7-8b64-8a65e0f7a6ab in use.
Neutron server returns request_ids: ['req-6ad52c9d-329c-4e88-aac0-0c64dfecb801']
2018-04-16 14:18:43.926 14274 WARNING octavia.network.drivers.neutron.allowed_address_pairs [-] Attempt 4 to remove security group 5af1ea07-141b-46c7-8b64-8a65e0f7a6ab failed.: Conflict: Security Group 5af1ea07-141b-46c7-8b64-8a65e0f7a6ab in use.
Neutron server returns request_ids: ['req-8710b9cf-91c8-4310-9526-639a3998d93b']
In the example above, the OpenStack Networking service does not allow the security group for the octavia instance to be deleted because of the attached network port. This condition prevents the octavia instance from deleting.
To resolve this issue, find the neutron ports that are associated with the security group mentioned in the worker log and delete them. You can do this by checking the ports that are associated with both the network to which the load balancer is attached and the nova instances with the name that contains “vrrp” (the load balancer amphorae).
- Find the
vip_network_idassociated with the octavia instance:
1. $ openstack loadbalancer show 52034239-a49d-41a9-a58d-7b2b880b98f7 |grep vip_network_id
System response:
| vip_network_id | a8a50667-c783-4d0a-a399-422dc8c8ce2b |
- Find the port associated with the security group :
$ for i in `openstack port list --network a8a50667-c783-4d0a-a399-422dc8c8ce2b |grep vrrp |awk {'print $2'}`; do echo; echo "port: $i"; openstack port show $i |grep security_group_ids; done
System response:
port: 039fe0bd-cbda-4063-83e3-574ee8e67b39
| security_group_ids    | d2381d94-fbcf-4a22-89bf-8a74e8556e50                                     |

port: 4ba0ceb1-0e4e-437a-b9bd-91b33aaa545f
| security_group_ids    | 16907006-e689-4218-a0e8-360874b72932                                     |

port: 650f6f17-9008-482d-aa25-fa01bf650395
| security_group_ids    | 3e0d5d64-7281-4155-97c4-4cac1dc7dd4c                                     |

port: 8b085666-f128-497e-a83c-2fb193aed30f                      <<-
| security_group_ids    | 5af1ea07-141b-46c7-8b64-8a65e0f7a6ab   <<- Note matching security group  |

port: a6bbbddb-fb00-4bd8-bbad-69b99dac8551
| security_group_ids    | e129a55a-5000-4bce-8bce-b5f205267977                                     |

port: cd0f7f7d-112c-4c21-a970-c57195f1dcf6
| security_group_ids    | d2381d94-fbcf-4a22-89bf-8a74e8556e50                                     |

port: e621b5e5-a975-42a3-8656-8f6589fb1c79
| security_group_ids    | 16907006-e689-4218-a0e8-360874b72932                                     |

port: ffdd362c-9dd6-410c-b12e-c86b51ffc328
| security_group_ids    | 3e0d5d64-7281-4155-97c4-4cac1dc7dd4c                                     |
- Delete the associated port:
$ openstack port delete 8b085666-f128-497e-a83c-2fb193aed30f
- Delete the load balancer instance:
$ openstack loadbalancer delete --cascade 52034239-a49d-41a9-a58d-7b2b880b98f7
Troubleshooting Kubespray
Kubespray is a series of Ansbile playbooks written to deploy and configure Kubernetes. The kaasctl command executes Kubespray after setting up the appropriate infrastructure. Occasionally, an issue may arise that causes a deployment failure.
Ansible fails to connect by using SSH to one or more nodes
A known issue occurs when one or more nodes cannot retrieve the SSH key for Ansible to connect to them. The Ansible playbook execution fails with the following error:
UNREACHABLE! => {"changed": false, "msg": "Failed to connect to the host via ssh: Permission denied (publickey,password,keyboard-interactive).\r\n", "unreachable": true}
To troubleshoot this issue, complete the following steps:
- Analyze the Ansible output and determine the node or nodes on which this error occurred.
- Determine the Terraform resource for this node by analyzing /provider/clusters/clustername/terraform.tfstate.
- Mark the node or nodes in question as unhealthy by running the
terraform taintcommand.
terraform taint -module='compute' <resource-name>
Example:
terraform taint -module='compute' 'openstack_compute_instance_v2.etcd.4
- Rerun the
kaasctl cluster createcommand to rebuild the infrastructure and rerun the Kubespray Ansible.
Kubernetes tips, tricks, and one-liners
One-liners
Connect to each Kubernetes master or worker node using SSH and run a command:
while read ip; do echo $ip; ssh -o UserKnownHostsFile=/dev/null -o StrictHostKeyChecking=no -i clusters/$K8S_CLUSTER_NAME/id_rsa_core core@$ip uptime </dev/null; done < <(kubectl get no -o jsonpath='{range.items[*].status.addresses[?(@.type=="ExternalIP")]}{.address}{"\n"}{end}')
Find released PersistentVolumes:
kubectl get pv -o jsonpath='{range.items[?(@.status.phase=="Released")]}{.metadata.name}{"\n"}{end}'
Get an ingress IP:
kubectl get svc nginx-ingress-controller -n rackspace-system -o jsonpath='{.status.loadBalancer.ingress[0].ip}'
Get last 100 lines of Pod logs for a specific label:
kubectl -n rackspace-system get pods -o name -l k8s-app=nginx-ingress-controller | cut -d: -f2 | xargs -I{} kubectl -n rackspace-system logs {} --tail=100
Get the number of Pods per node:
kubectl get pods --all-namespaces -o json | jq '.items[] | .spec.nodeName' -r | sort | uniq -c
JSON output
When running kubectl, you can specify different output formats from json/yaml/wide/name/jsonpath. For example, you can get the output in JSON and then pipe it to the jq JSON parser for targeted queries.
Find all pods running on all nodes:
# kubectl get pods --all-namespaces -o json | jq '.items | map({podName: .metadata.name, nodeName: .spec.nodeName}) | group_by(.nodeName) | map({nodeName: .[0].nodeName, pods: map(.podName)})'
[
  {
    "nodeName": "shanec-cluster-master-0",
    "pods": [
      "etcd-operator-4083686351-z135s",
      "pod-checkpointer-4mjh4-shanec-cluster-master-0",
      "pod-checkpointer-4mjh4",
      "kube-scheduler-1310662694-vzp76",
      "kube-scheduler-1310662694-ldt1p",
      "kube-proxy-zjgt6",
      "kube-apiserver-6nkjx",
      "kube-flannel-w3n6m",
      "kube-etcd-network-checkpointer-4ws55",
      "kube-etcd-0000",
      "kube-dns-2431531914-2phz9",
      "kube-controller-manager-1138177157-rrpfg",
      "kube-controller-manager-1138177157-j9fg2"
    ]
  },
  {
    "nodeName": "shanec-cluster-master-1",
    "pods": [
      "kube-proxy-sf9lc",
      "kube-etcd-network-checkpointer-z3n9l",
      "kube-apiserver-44l0p",
      "pod-checkpointer-kwt3x-shanec-cluster-master-1",
      "pod-checkpointer-kwt3x",
      "etcd-operator-4083686351-sxpmh",
      "kube-flannel-b6jcx"
    ]
  }
]
You can also use JSONPath with kubectl to get specific values:
$ INGRESS=$(kubectl get svc nginx-ingress-controller -n rackspace-system -o jsonpath='{.status.loadBalancer.ingress[0].ip}')
$ echo $INGRESS
172.99.77.41
$ curl $INGRESS
default backend - 404
Rackspace Kubernetes-as-a-Service architecture
RPCO
NOTE: Some of these features are not yet implemented, so depending on what phase they are deployed in, customer clusters might be missing certain aspects.
The following diagram describes the Rackspace KaaS architecture.

Neutron
The following diagram describes the neutron architecture:

The stack
- OpenStack
- Terraform (Deployment)
- Tectonic / Bootkube / Matchbox (Deployment)
- Self-hosted Kubernetes cluster
As the above document describes in detail, using a self-hosted implementation allows operators to manage a Kubernetes cluster just like any other application running on Kubernetes. We can use all of the Kubernetes built-in primitives to maintain the cluster. This allows us to scale Rackspace KaaS components up and down as needed, and more importantly enable continuous upgrades of Kubernetes versions and APIs.
An RPCO environment has been created in IAD3 for the development beta phase. We then use https://github.com/rackerlabs/kaas/tree/master/tools/installer to begin cluster deployment. Terraform communicates with the RPCO environment to create all the required resources, such as instances, networking, LBaaS, security groups, and volumes.
The control plane includes 3 Kubernetes master nodes with Container Linux OS. The data plane includes 3 Kubernetes worker nodes with Container Linux OS.
The initial phase flavor has the following specifications:
Kubernetes master nodes:
- 2 vCPUs
- 4 GB RAM
Kubernetes worker nodes:
- 4 vCPUs
- 8 GB RAM
After Terraform creates all the required resources, tectonic-installer performs the Kubernetes cluster installation inside those instances. The entire process is automated using Kubernetes Installer, Terraform, tectonic-installer, and bootkube.
After the cluster installation is complete, tectonic-installer provides a kubeconfig file that you can use to access the cluster by using the standard Kubernetes client called kubectl. You can also use the provided SSH public and private keys to access the instances running the cluster along with monitoring credentials to access Prometheus. Customers should not ever need to log in to the underlying instances and should only require the kubeconfig file to access the Kubernetes API. Rackspace operators use SSH keys to troubleshoot issues that occur at the Kubernetes master and worker nodes OS level.
Deployed nodes and services
This section provides useful commands and sample outputs from a Kubernetes cluster deployed by Rackspace KaaS 1.1.
View the list of Kubernetes nodes:
$ kubectl get nodes -o wide
NAME                    STATUS    AGE       VERSION           EXTERNAL-IP    OS-IMAGE                                       KERNEL-VERSION
test-cluster-master-0   Ready     master    32d       v1.9.6+rackspace.0   172.99.77.133   Container Linux by CoreOS 1745.7.0 (Rhyolite)   4.14.48-coreos-r2   docker://18.3.1
test-cluster-master-1   Ready     master    32d       v1.9.6+rackspace.0   172.99.77.139   Container Linux by CoreOS 1745.7.0 (Rhyolite)   4.14.48-coreos-r2   docker://18.3.1
test-cluster-master-2   Ready     master    32d       v1.9.6+rackspace.0   172.99.77.102   Container Linux by CoreOS 1745.7.0 (Rhyolite)   4.14.48-coreos-r2   docker://18.3.1
test-cluster-worker-0   Ready     node      32d       v1.9.6+rackspace.0   172.99.77.47    Container Linux by CoreOS 1745.7.0 (Rhyolite)   4.14.48-coreos-r2   docker://18.3.1
test-cluster-worker-1   Ready     node      32d       v1.9.6+rackspace.0   172.99.77.54    Container Linux by CoreOS 1745.7.0 (Rhyolite)   4.14.48-coreos-r2   docker://18.3.1
test-cluster-worker-2   Ready     node      32d       v1.9.6+rackspace.0   172.99.77.30    Container Linux by CoreOS 1745.7.0 (Rhyolite)   4.14.48-coreos-r2   docker://18.3.1
View the information about Pods, Services, Deployments, ReplicaSets, StatefulSets in all namespaces:
$ kubectl get all --all-namespaces
NAMESPACE NAME DESIRED CURRENT READY UP-TO-DATE AVAILABLE NODE SELECTOR AGE
kube-system ds/kube-apiserver 3 3 3 3 3 node-role.kubernetes.io/master= 32d
kube-system ds/kube-calico 6 6 6 6 6 <none> 32d
kube-system ds/kube-flannel 6 6 6 6 6 <none> 32d
kube-system ds/kube-proxy 6 6 6 6 6 <none> 32d
kube-system ds/npd-v0.4.1 6 6 6 6 6 <none> 32d
kube-system ds/pod-checkpointer 3 3 3 3 3 node-role.kubernetes.io/master= 32d
rackspace-system ds/configure-oom 6 6 6 6 6 <none> 32d
rackspace-system ds/container-linux-update-agent 6 6 6 6 6 <none> 32d
rackspace-system ds/fluentd-es 6 6 6 6 6 <none> 32d
rackspace-system ds/node-exporter 3 3 3 3 3 node-role.kubernetes.io/node= 32d
rackspace-system ds/node-exporter-master 3 3 3 3 3 node-role.kubernetes.io/master= 32d
NAMESPACE NAME DESIRED CURRENT UP-TO-DATE AVAILABLE AGE
default deploy/mysql 1 1 1 1 27d
kube-system deploy/kube-controller-manager 3 3 3 3 32d
kube-system deploy/kube-dns 2 2 2 2 32d
kube-system deploy/kube-scheduler 3 3 3 3 32d
rackspace-system deploy/container-linux-update-operator 1 1 1 1 32d
rackspace-system deploy/default-http-backend 1 1 1 1 32d
rackspace-system deploy/elasticsearch-exporter 1 1 1 1 32d
rackspace-system deploy/kibana 1 1 1 1 32d
rackspace-system deploy/kube-state-metrics 1 1 1 1 32d
rackspace-system deploy/maas-agent 1 1 1 1 32d
rackspace-system deploy/nginx-ingress-controller 2 2 2 2 32d
rackspace-system deploy/prometheus-operator 1 1 1 1 32d
rackspace-system deploy/registry 1 1 1 1 32d
rackspace-system deploy/registry-image-scan 1 1 1 1 32d
rackspace-system deploy/registry-job 1 1 1 1 32d
rackspace-system deploy/registry-nginx 1 1 1 1 32d
rackspace-system deploy/registry-ui 1 1 1 1 32d
NAMESPACE NAME DESIRED CURRENT READY AGE
default rs/mysql-5f7dcd7b68 1 1 1 27d
kube-system rs/kube-controller-manager-69c8454465 3 3 3 32d
kube-system rs/kube-dns-7dbc78b8d5 2 2 2 32d
kube-system rs/kube-scheduler-7c89b9fdc 3 3 3 32d
rackspace-system rs/container-linux-update-operator-6974b6b648 1 1 1 32d
rackspace-system rs/default-http-backend-5d98c568f9 1 1 1 32d
rackspace-system rs/elasticsearch-exporter-f9b7f9b6b 1 1 1 32d
rackspace-system rs/kibana-76c4c44bcb 1 1 1 32d
rackspace-system rs/kube-state-metrics-5467457b6b 0 0 0 32d
rackspace-system rs/kube-state-metrics-6d995c9574 1 1 1 32d
rackspace-system rs/maas-agent-b7c99b967 1 1 1 32d
rackspace-system rs/nginx-ingress-controller-5dd8944c96 2 2 2 32d
rackspace-system rs/prometheus-operator-b88fb94cf 1 1 1 32d
rackspace-system rs/registry-b59594c6b 1 1 1 32d
rackspace-system rs/registry-image-scan-5fc89dbddd 1 1 1 32d
rackspace-system rs/registry-job-ccd4c79f 1 1 1 32d
rackspace-system rs/registry-nginx-8646db4ff 1 1 1 32d
rackspace-system rs/registry-ui-795b57ccd5 1 1 1 32d
NAMESPACE NAME DESIRED CURRENT READY UP-TO-DATE AVAILABLE NODE SELECTOR AGE
kube-system ds/kube-apiserver 3 3 3 3 3 node-role.kubernetes.io/master= 32d
kube-system ds/kube-calico 6 6 6 6 6 <none> 32d
kube-system ds/kube-flannel 6 6 6 6 6 <none> 32d
kube-system ds/kube-proxy 6 6 6 6 6 <none> 32d
kube-system ds/npd-v0.4.1 6 6 6 6 6 <none> 32d
kube-system ds/pod-checkpointer 3 3 3 3 3 node-role.kubernetes.io/master= 32d
rackspace-system ds/configure-oom 6 6 6 6 6 <none> 32d
rackspace-system ds/container-linux-update-agent 6 6 6 6 6 <none> 32d
rackspace-system ds/fluentd-es 6 6 6 6 6 <none> 32d
rackspace-system ds/node-exporter 3 3 3 3 3 node-role.kubernetes.io/node= 32d
rackspace-system ds/node-exporter-master 3 3 3 3 3 node-role.kubernetes.io/master= 32d
NAMESPACE NAME DESIRED CURRENT UP-TO-DATE AVAILABLE AGE
kube-system deploy/kube-controller-manager 3 3 3 3 32d
kube-system deploy/kube-dns 2 2 2 2 32d
kube-system deploy/kube-scheduler 3 3 3 3 32d
rackspace-system deploy/container-linux-update-operator 1 1 1 1 32d
rackspace-system deploy/default-http-backend 1 1 1 1 32d
rackspace-system deploy/elasticsearch-exporter 1 1 1 1 32d
rackspace-system deploy/kibana 1 1 1 1 32d
rackspace-system deploy/kube-state-metrics 1 1 1 1 32d
rackspace-system deploy/maas-agent 1 1 1 1 32d
rackspace-system deploy/nginx-ingress-controller 2 2 2 2 32d
rackspace-system deploy/prometheus-operator 1 1 1 1 32d
rackspace-system deploy/registry 1 1 1 1 32d
rackspace-system deploy/registry-image-scan 1 1 1 1 32d
rackspace-system deploy/registry-job 1 1 1 1 32d
rackspace-system deploy/registry-nginx 1 1 1 1 32d
rackspace-system deploy/registry-ui 1 1 1 1 32d
NAMESPACE NAME DESIRED CURRENT READY AGE
kube-system rs/kube-controller-manager-69c8454465 3 3 3 32d
kube-system rs/kube-dns-7dbc78b8d5 2 2 2 32d
kube-system rs/kube-scheduler-7c89b9fdc 3 3 3 32d
rackspace-system rs/container-linux-update-operator-6974b6b648 1 1 1 32d
rackspace-system rs/default-http-backend-5d98c568f9 1 1 1 32d
rackspace-system rs/elasticsearch-exporter-f9b7f9b6b 1 1 1 32d
rackspace-system rs/kibana-76c4c44bcb 1 1 1 32d
rackspace-system rs/kube-state-metrics-5467457b6b 0 0 0 32d
rackspace-system rs/kube-state-metrics-6d995c9574 1 1 1 32d
rackspace-system rs/maas-agent-b7c99b967 1 1 1 32d
rackspace-system rs/nginx-ingress-controller-5dd8944c96 2 2 2 32d
rackspace-system rs/prometheus-operator-b88fb94cf 1 1 1 32d
rackspace-system rs/registry-b59594c6b 1 1 1 32d
rackspace-system rs/registry-image-scan-5fc89dbddd 1 1 1 32d
rackspace-system rs/registry-job-ccd4c79f 1 1 1 32d
rackspace-system rs/registry-nginx-8646db4ff 1 1 1 32d
rackspace-system rs/registry-ui-795b57ccd5 1 1 1 32d
NAMESPACE NAME DESIRED CURRENT AGE
monitoring statefulsets/prometheus-customer 2 2 32d
rackspace-system statefulsets/alertmanager-main 3 3 32d
rackspace-system statefulsets/es-data 3 3 32d
rackspace-system statefulsets/grafana 1 1 32d
rackspace-system statefulsets/prometheus-k8s 2 2 32d
rackspace-system statefulsets/registry-admin 1 1 32d
rackspace-system statefulsets/registry-image-scan-postgres 1 1 32d
rackspace-system statefulsets/registry-mysql 1 1 32d
NAMESPACE NAME DESIRED SUCCESSFUL AGE
rackspace-system jobs/curator-1531094460 1 1 2d
rackspace-system jobs/curator-1531180860 1 1 1d
rackspace-system jobs/curator-1531267260 1 1 15h
rackspace-system jobs/etcdsnapshot-1531238820 1 1 23h
rackspace-system jobs/etcdsnapshot-1531267620 1 1 15h
rackspace-system jobs/etcdsnapshot-1531296420 1 1 7h
NAMESPACE NAME SCHEDULE SUSPEND ACTIVE LAST SCHEDULE AGE
rackspace-system cronjobs/curator 1 0 * * * False 0 15h 32d
rackspace-system cronjobs/etcdsnapshot 7 */8 * * * False 0 7h 32d
NAMESPACE NAME READY STATUS RESTARTS AGE
kube-system po/kube-apiserver-dn7ll 1/1 Running 3 32d
kube-system po/kube-apiserver-jxct9 1/1 Running 3 32d
kube-system po/kube-apiserver-wm9pp 1/1 Running 3 32d
kube-system po/kube-calico-46v7s 2/2 Running 6 32d
kube-system po/kube-calico-522pf 2/2 Running 6 32d
kube-system po/kube-calico-5s4tz 2/2 Running 6 32d
kube-system po/kube-calico-hdnlb 2/2 Running 6 32d
kube-system po/kube-calico-kdh44 2/2 Running 6 32d
kube-system po/kube-calico-mk69l 2/2 Running 6 32d
kube-system po/kube-controller-manager-69c8454465-8hj7z 1/1 Running 8 32d
kube-system po/kube-controller-manager-69c8454465-qfstl 1/1 Running 5 32d
kube-system po/kube-controller-manager-69c8454465-xmzr4 1/1 Running 6 32d
kube-system po/kube-dns-7dbc78b8d5-4h2nn 3/3 Running 9 32d
kube-system po/kube-dns-7dbc78b8d5-pjl6l 3/3 Running 9 32d
kube-system po/kube-flannel-5n7xl 1/1 Running 6 32d
kube-system po/kube-flannel-cw4vj 1/1 Running 5 32d
kube-system po/kube-flannel-fhdxs 1/1 Running 8 32d
kube-system po/kube-flannel-n6vrl 1/1 Running 6 32d
kube-system po/kube-flannel-s958v 1/1 Running 6 32d
kube-system po/kube-flannel-xp2wd 1/1 Running 6 32d
kube-system po/kube-proxy-6n2rg 1/1 Running 3 32d
kube-system po/kube-proxy-b44ml 1/1 Running 3 32d
kube-system po/kube-proxy-qbmfg 1/1 Running 3 32d
kube-system po/kube-proxy-rxrtc 1/1 Running 3 32d
kube-system po/kube-proxy-vn275 1/1 Running 3 32d
kube-system po/kube-proxy-x9jpd 1/1 Running 3 32d
kube-system po/kube-scheduler-7c89b9fdc-84pnf 1/1 Running 6 32d
kube-system po/kube-scheduler-7c89b9fdc-n6f4n 1/1 Running 4 32d
kube-system po/kube-scheduler-7c89b9fdc-ztc4z 1/1 Running 8 32d
kube-system po/npd-v0.4.1-2lbkw 1/1 Running 3 32d
kube-system po/npd-v0.4.1-48qz4 1/1 Running 3 32d
kube-system po/npd-v0.4.1-96h4n 1/1 Running 3 32d
kube-system po/npd-v0.4.1-dblpj 1/1 Running 3 32d
kube-system po/npd-v0.4.1-l4fn5 1/1 Running 3 32d
kube-system po/npd-v0.4.1-qbnsh 1/1 Running 3 32d
kube-system po/pod-checkpointer-8qj8m 1/1 Running 3 32d
kube-system po/pod-checkpointer-8qj8m-kubernetes-skarslioglu-master-2 1/1 Running 3 32d
kube-system po/pod-checkpointer-9nhzt 1/1 Running 3 32d
kube-system po/pod-checkpointer-9nhzt-kubernetes-skarslioglu-master-0 1/1 Running 3 32d
kube-system po/pod-checkpointer-mfr6r 1/1 Running 3 32d
kube-system po/pod-checkpointer-mfr6r-kubernetes-skarslioglu-master-1 1/1 Running 3 32d
monitoring po/prometheus-customer-0 2/2 Running 0 25d
monitoring po/prometheus-customer-1 2/2 Running 0 25d
rackspace-system po/alertmanager-main-0 2/2 Running 0 25d
rackspace-system po/alertmanager-main-1 2/2 Running 0 24d
rackspace-system po/alertmanager-main-2 2/2 Running 0 24d
rackspace-system po/configure-oom-5cbcd 1/1 Running 3 32d
rackspace-system po/configure-oom-hwwql 1/1 Running 3 32d
rackspace-system po/configure-oom-kqw6c 1/1 Running 3 32d
rackspace-system po/configure-oom-mffk4 1/1 Running 3 32d
rackspace-system po/configure-oom-n7nv5 1/1 Running 3 32d
rackspace-system po/configure-oom-tcj4k 1/1 Running 3 32d
rackspace-system po/container-linux-update-agent-4dmz9 1/1 Running 5 32d
rackspace-system po/container-linux-update-agent-8gnhp 1/1 Running 6 32d
rackspace-system po/container-linux-update-agent-j8s2p 1/1 Running 4 32d
rackspace-system po/container-linux-update-agent-q57g6 1/1 Running 6 32d
rackspace-system po/container-linux-update-agent-qjl2f 1/1 Running 6 32d
rackspace-system po/container-linux-update-agent-rt28q 1/1 Running 6 32d
rackspace-system po/container-linux-update-operator-6974b6b648-h6r8g 1/1 Running 0 25d
rackspace-system po/default-http-backend-5d98c568f9-rbxb4 1/1 Running 0 25d
rackspace-system po/elasticsearch-exporter-f9b7f9b6b-g84gl 1/1 Running 0 25d
rackspace-system po/es-data-0 1/1 Running 1 25d
rackspace-system po/es-data-1 1/1 Running 0 24d
rackspace-system po/es-data-2 1/1 Running 0 24d
rackspace-system po/fluentd-es-2m729 1/1 Running 3 32d
rackspace-system po/fluentd-es-98nrn 1/1 Running 3 32d
rackspace-system po/fluentd-es-md2xd 1/1 Running 3 32d
rackspace-system po/fluentd-es-spcjc 1/1 Running 3 32d
rackspace-system po/fluentd-es-xx5d8 1/1 Running 3 32d
rackspace-system po/fluentd-es-z42rz 1/1 Running 3 32d
rackspace-system po/grafana-0 2/2 Running 0 24d
rackspace-system po/kibana-76c4c44bcb-6jpmv 1/1 Running 0 24d
rackspace-system po/kube-state-metrics-6d995c9574-bb252 2/2 Running 0 25d
rackspace-system po/maas-agent-b7c99b967-s28kk 1/1 Running 0 25d
rackspace-system po/nginx-ingress-controller-5dd8944c96-h8ftv 1/1 Running 0 25d
rackspace-system po/nginx-ingress-controller-5dd8944c96-pdd4k 1/1 Running 5 24d
rackspace-system po/node-exporter-2dfhz 1/1 Running 3 32d
rackspace-system po/node-exporter-master-5m2jj 1/1 Running 3 32d
rackspace-system po/node-exporter-master-8g8p8 1/1 Running 3 32d
rackspace-system po/node-exporter-master-jhch6 1/1 Running 3 32d
rackspace-system po/node-exporter-wprgr 1/1 Running 3 32d
rackspace-system po/node-exporter-wtndh 1/1 Running 3 32d
rackspace-system po/prometheus-k8s-0 2/2 Running 0 25d
rackspace-system po/prometheus-k8s-1 2/2 Running 0 25d
rackspace-system po/prometheus-operator-b88fb94cf-9hsc8 1/1 Running 0 24d
rackspace-system po/registry-admin-0 0/1 Pending 0 24d
rackspace-system po/registry-b59594c6b-kcb7c 2/2 Running 0 24d
rackspace-system po/registry-image-scan-5fc89dbddd-h7n5l 1/1 Running 34 24d
rackspace-system po/registry-image-scan-postgres-0 1/1 Running 0 25d
rackspace-system po/registry-job-ccd4c79f-wmm8n 1/1 Running 0 25d
rackspace-system po/registry-mysql-0 1/1 Running 0 25d
rackspace-system po/registry-nginx-8646db4ff-fd89c 1/1 Running 0 25d
rackspace-system po/registry-ui-795b57ccd5-nnh59 1/1 Running 0 25d
NAMESPACE NAME TYPE CLUSTER-IP EXTERNAL-IP PORT(S) AGE
kube-system svc/kube-controller-manager-prometheus-discovery ClusterIP None <none> 10252/TCP 32d
kube-system svc/kube-dns ClusterIP 10.3.0.10 <none> 53/UDP,53/TCP 32d
kube-system svc/kube-dns-prometheus-discovery ClusterIP None <none> 10055/TCP,10054/TCP 32d
kube-system svc/kube-scheduler-prometheus-discovery ClusterIP None <none> 10251/TCP 32d
monitoring svc/prometheus ClusterIP 10.3.56.163 <none> 9090/TCP 32d
monitoring svc/prometheus-operated ClusterIP None <none> 9090/TCP 32d
rackspace-system svc/alertmanager-main ClusterIP 10.3.55.95 <none> 9093/TCP 32d
rackspace-system svc/alertmanager-operated ClusterIP None <none> 9093/TCP,6783/TCP 32d
rackspace-system svc/clair ClusterIP 10.3.94.67 <none> 6060/TCP,6061/TCP 32d
rackspace-system svc/default-http-backend ClusterIP 10.3.129.195 <none> 80/TCP 32d
rackspace-system svc/elasticsearch-discovery ClusterIP 10.3.53.97 <none> 9300/TCP 32d
rackspace-system svc/elasticsearch-exporter ClusterIP 10.3.6.162 <none> 9108/TCP 32d
rackspace-system svc/elasticsearch-logging ClusterIP 10.3.210.8 <none> 9200/TCP 32d
rackspace-system svc/etcd-prometheus-discovery ClusterIP None <none> 2379/TCP,9100/TCP 32d
rackspace-system svc/grafana ClusterIP 10.3.5.156 <none> 80/TCP 32d
rackspace-system svc/jobservice ClusterIP 10.3.186.54 <none> 80/TCP 32d
rackspace-system svc/kube-state-metrics ClusterIP 10.3.243.54 <none> 8080/TCP 32d
rackspace-system svc/kubelet ClusterIP None <none> 10250/TCP 32d
rackspace-system svc/logs ClusterIP 10.3.250.231 <none> 5601/TCP 32d
rackspace-system svc/nginx-ingress-controller LoadBalancer 10.3.22.22 172.99.77.148 80:30080/TCP,443:30443/TCP 32d
rackspace-system svc/node-exporter ClusterIP None <none> 9100/TCP 32d
rackspace-system svc/node-exporter-master ClusterIP None <none> 9100/TCP 32d
rackspace-system svc/postgres ClusterIP 10.3.83.22 <none> 5432/TCP 32d
rackspace-system svc/prometheus-k8s ClusterIP 10.3.217.140 <none> 9090/TCP 32d
rackspace-system svc/prometheus-operated ClusterIP None <none> 9090/TCP 32d
rackspace-system svc/prometheus-operator ClusterIP 10.3.244.34 <none> 8080/TCP 32d
rackspace-system svc/registree ClusterIP 10.3.24.54 <none> 5000/TCP,5001/TCP 32d
rackspace-system svc/registree-admin ClusterIP 10.3.7.55 <none> 8080/TCP 32d
rackspace-system svc/registree-exporter ClusterIP 10.3.244.173 <none> 7979/TCP 32d
rackspace-system svc/registree-mysql ClusterIP 10.3.54.139 <none> 3306/TCP 32d
rackspace-system svc/registree-nginx LoadBalancer 10.3.0.173 172.99.77.136 443:32021/TCP 32d
rackspace-system svc/ui ClusterIP 10.3.227.109 <none> 8080/TCP 32d
View the list of namespaces:
$ kubectl get ns
NAME               STATUS    AGE
default            Active    32d
kube-public        Active    32d
kube-system        Active    32d
monitoring         Active    32d
rackspace-system   Active    32d
tectonic-system    Active    32d
Get the information about ingress resources:
$ k get ing --all-namespaces -o wide
NAMESPACE          NAME         HOSTS     ADDRESS         PORTS     AGE
monitoring         prometheus   *         172.99.77.148   80        32d
rackspace-system   grafana      *         172.99.77.148   80        32d
rackspace-system   kibana       *         172.99.77.148   80        32d
Get the information about the configured StorageClasses (we only use Cinder):
$ kubectl get sc
NAME                  PROVISIONER            AGE
openstack (default)   kubernetes.io/cinder   32d
Control plane
The following list includes the core pieces that Rackspace operators need to maintain:
- etcd data store
- Configured as a stateful app using the etcd Operator.
- Clustered and replicated (3 replicas).
- 50%+1 availability to write. Will go read-only if it falls below the threshold.
- Kubernetes API server
- Stateless app that is backed by etcd.
- Horizontally scalable (3 replicas).
- Requires a load balancer (we use neutron LBaaS).
- Kubernetes Cloud Controller Manager
- Manages the core control loops.
- Watches the shared state of the cluster through the API server and makes changes attempting to move the current state towards the desired state.
- Leader election is enabled by default, not horizontally scalable.
- 3 replicas.
- Kubernetes scheduler
- Schedules pods.
- Leader election is enabled by default, not horizontally scalable.
- 3 replicas.
- Kubernetes DNS add-on
- Pre-defined service IP configured on
kubelets. - DNS servers run as pods on Kubernetes.
- Used by many applications but not Kubernetes itself.
- Not HA yet (WIP).
- Pre-defined service IP configured on
- Kubelet (worker nodes)
- The primary node agent that runs on each worker node. The Kubelet takes a set of PodSpecs that are provided through various mechanisms, such as apiserver, and ensures that the containers described in those PodSpecs are running and healthy. The Kubelet does not manage containers that were not created by Kubernetes.
- Kubernetes Proxy
- Runs on every node.
- Reflects services as defined in the Kubernetes API on each node and can do simple TCP and UDP stream forwarding or round-robin TCP and UDP forwarding across a set of backends.
- Overlay network (Flannel)
- Runs on every node.
- Responsible for providing a layer 3 IPv4 network between multiple nodes in a cluster through a VXLAN.
Rackspace managed services
Rackspace provides the following managed services:
Ingress controller (HA)
- By default, Rackspace KaaS deploys an NGINX®-based ingress controller that can be used to expose services externally. When an ingress resource is created and updated, it updates the NGINX configuration in the ingress controller to route traffic for that new path.
- You need to locate the ingress controller external IP. You can use this ingress IP to access the rest of the Rackspace managed services.
To get the IP address of the ingress controller, run the following commands:
$ INGRESS=$(kubectl get svc nginx-ingress-controller -n rackspace-system -o jsonpath='{.status.loadBalancer.ingress[0].ip}')
$ echo $INGRESS
172.99.77.41
$ curl $INGRESS
default backend - 404
By default, Rackspace KaaS deploys the following ingress resources:
 $ kubectl get ing --all-namespaces
NAMESPACE          NAME                   HOSTS                                                ADDRESS         PORTS     AGE
monitoring         prometheus             prometheus.test.mk8s.systems       172.99.77.122   80, 443   11m
rackspace-system   grafana                grafana.test.mk8s.systems          172.99.77.122   80, 443   11m
rackspace-system   kibana                 kibana.test.mk8s.systems           172.99.77.122   80, 443   12m
rackspace-system   kubernetes-dashboard   dashboard.test.mk8s.systems        172.99.77.122   80, 443   10m
rackspace-system   prometheus             prometheus-k8s.test.mk8s.systems   172.99.77.122   80, 443   11m
rackspace-system   registry-root          registry.test.mk8s.systems         172.99.77.122   80, 443   12m
rackspace-system   registry-v2            registry.test.mk8s.systems         172.99.77.122   80, 443   12m
To learn how to access a specific resource, run the kubectl describe command. For example, to learn how to access the Kibana ingress resource, run the following command:
$ kubectl describe ing kibana -n rackspace-system
Name:             kibana
Namespace:        rackspace-system
Address:          172.99.77.122
Default backend:  default-http-backend:80 (<none>)
TLS:
  SNI routes kibana.test.mk8s.systems
Rules:
  Host                                        Path  Backends
  ----                                        ----  --------
  kibana.test.mk8s.systems
                                              /   kibana-oauth-proxy:8080 (<none>)
Annotations:
Events:
  Type    Reason  Age   From                      Message
  ----    ------  ----  ----                      -------
  Normal  CREATE  13m   nginx-ingress-controller  Ingress rackspace-system/kibana
  Normal  CREATE  13m   nginx-ingress-controller  Ingress rackspace-system/kibana
  Normal  UPDATE  13m   nginx-ingress-controller  Ingress rackspace-system/kibana
  Normal  UPDATE  13m   nginx-ingress-controller  Ingress rackspace-system/kibana
In the output above, you can see the path to access Kibana: https://kibana.test.mk8s.systems.
Log aggregation with Elasticsearch, Fluentd and Kibana (EFK)
https://kibana.test.mk8s.systems
Grafana monitoring
https://grafana.test.mk8s.systems
Aggregated metrics with Prometheus
https://prometheus.test.mk8s.systems
For more information, see:
Image registry
See Docker registry documentation.
Authentication system
See Authentication system architecture diagram.
Upgrade Rackspace KaaS
This section describes how to upgrade Kubernetes and related components, such as Container Linux. For information about how to upgrade the underlying cloud platform, such as Rackspace Private Cloud (RPC), see the corresponding documentation.
Upgrade KaaS
Use kaasctl to upgrade and patch the KaaS components. kaasctl provides a command to upgrade the Kubernetes cluster components, such as the version of Kubernetes, networking components, and so on.
View current versions
To view the list of current versions of the components, run the following command:
kaasctl cluster versions
To view the version of kaasctl, run the following command:
kaasctl version
Update the Kubernetes cluster components
To upgrade the Kubernetes cluster components on all nodes, use the kaasctl cluster update <cluster-name> command. You can run this command with the following options:
Cluster components upgrade options
| Option | Description |
|---|---|
| --components | A comma-separated list of components and versions to upgrade. The components include Calico, Flannel, Kubernetes, and so on. If no version is specified, kaasctl updates the component to the latest supported version. Example: kaasctl cluster update kubernetes-test --components "calico:3.1.4, flannel:0.10.1" |
| --node-names | A comma-separated list of nodes to upgrade. If no nodes are specified, kaasctl upgrades all nodes. Example: kaasctl cluster hotfix kubernetes-test --node-names kubernetes-test-k8s-master-ne-1, kubernetes-test-k8s-master-ne-2 |
| --skip-confirm | When specified, kaasctl skips the interactive confirmation prompt and updates the components automatically. Example: kaasctl cluster update kubernetes-test --skip-confirm |
| --list-versions | View the list of versions that kaasctl supports. Example: kaasctl cluster update kubernetes-test --list-versions |
Recover from a stack update
After a stack update is performed on an RPCR cloud, you must redeploy the KaaS OpenStack services. Until you redeploy the services, the Kubernetes cluster remains in a severely degraded state. To complete the recovery, you must also validate cluster functionality and the status of load balancers.
Pre-flight check
Check the status of octavia load balancers. If you see any issue, save the output for future investigation.
To perform a pre-flight check, complete the following steps:
- Connect to the Director node by using SSH.
sudo su - stack
- Run the
openstack-clicontainer to get octavia load balancer status:
docker run -it --rm --volume /home/stack:/data quay.io/rackspace/openstack-cli
- Source the customer-specific
.rcfile.
Note
This .rc is different from stackrc. For example, fico-shk01rc.v3.
Example:
source /data/fico-shk01rc.v3
- Get the list of load balancers:
openstack loadbalancer list
- Save the output for future troubleshooting purposes.
- Verify that the KaaS clusters are up an running by viewing the list of nodes.
Example:
set-shk-cluster1
kubeconfig file set to shk-cluster1 (/opt/rpc-mk8s/mk8s/tools/installer/clusters/kubernetes-shk-cluster1/generated/auth/kubeconfig)
kubectl get nodes
NAME                               STATUS    ROLES     AGE       VERSION
kubernetes-shk-cluster1-master-0   Ready     master    130d      v1.9.6+rackspace.1
kubernetes-shk-cluster1-master-1   Ready     master    152d      v1.9.6+rackspace.1
kubernetes-shk-cluster1-master-2   Ready     master    152d      v1.9.6+rackspace.1
kubernetes-shk-cluster1-worker-0   Ready     node      152d      v1.9.6+rackspace.1
kubernetes-shk-cluster1-worker-1   Ready     node      152d      v1.9.6+rackspace.1
kubernetes-shk-cluster1-worker-2   Ready     node      152d      v1.9.6+rackspace.1
Note
You cannot create the type=LoaBalancer service at this point.
Redeploy the KaaS OpenStack services
You can redeploy the KaaS OpenStack services by using the TripleO Ansible playbook. Export the name of the cloud for which the stack update was performed as the TRIPLEO_PLAN_NAME variable.
To redeploy the KaaS OpenStack services, run the following commands:
-
Connect to the Director node by using SSH.
-
Redeploy the KaaS OpenStack services:
Example:
sudo su - stack
export TRIPLEO_PLAN_NAME=fico-shk01
source ~/stackrc
cd /opt/rpc-mk8s/mk8s/rpc/rpc-r/osp12
ansible-playbook -i /usr/bin/tripleo-ansible-inventory -e "@mk8s-ansible-vars.yaml" site.yaml
Redeploy the designate HAProxy entries
You can redeploy the designate HAProxy entries by using the TripleO Ansible playbook. Export the name of the cloud for which the stack update was performed as the TRIPLEO_PLAN_NAME variable.
To redeploy the designate HAProxy entries, run the following commands:
- Connect to the Director node by using SSH.
- Redeploy the designate HAProxy entries.
Example:
sudo su - stack
export TRIPLEO_PLAN_NAME=fico-shk01
source ~/stackrc
cd /opt/rpc-mk8s/mk8s/rpc/rpc-r/designate
ansible-playbook -i /usr/bin/tripleo-ansible-inventory -e "@designate-vars.yaml" site.yaml --tags designate_haproxy
- Validate that the Designate API is responsive:
Example:
source /home/stack/fico-shk01rc.v3
openstack zone list --all
Redeploy octavia
You can redeploy octavia by using the configure_octavia.sh script. There are two RC files in your environment. One has .v3 and one does not. The script works with the file that does not include .v3.
You need to set the following environment variables:
OVERCLOUD_RC- The location of your V2 overcloud.rcfile.STACK_RC- The path undercloud OpenStack.rcfile.TRIPLEO_PLAN_NAME- The name of the overcloud cluster.NETWORK_PREFIX- The first three octets of the public keystone endpoint address.AMP_NETWORK_NAME- The name of the amphora network. Typically, it isext-net.CONTROLLER_REGEX- The regex that determines the controllers in the undercloud.
To redeploy octavia, complete the following steps:
-
Connect to the Director node by using SSH.
-
Export the following required environment variables:
Example
export OVERCLOUD_RC=/home/stack/fico-shk01rc export STACK_RC=/home/stack/stackrc export TRIPLEO_PLAN_NAME=fico-shk01 export NETWORK_PREFIX=10.106.40 export AMP_NETWORK_NAME=ext-net export CONTROLLER_REGEX='*controller.*' -
Redeploy octavia:
Example:
 cd /opt/rpc-mk8s/mk8s/rpc/rpc-r/octavia
./configure_octavia.sh
- Validate that the octavia API is responsive:
- # Run the
openstack-clicontainer:
docker run -it --rm --volume /home/stack:/data quay.io/rackspace/openstack-cli
-
Source customer specific
.rcfile:Note
This
.rcfile is different fromstackrc. For example,fico-shk01rc.v3. -
Display the list of load balancers:
openstack loadbalancer list
Restart kube-controller-manager on the Kubernetes cluster
To restart kube-controller-manager on the Kubernetes cluster, complete the following commands:
- To access the Kubernetes cluster from the Director node, find the
controller1node IP address:
source ~/stackrc
openstack server list
- Using the
ctlplane=IP listed for the controller, find the controller manager pods on the Kubernetes cluster:
 ssh heat-admin@IP
su - root
cd /opt/rpc-mk8s/mk8s/tools/installer
export KUBECONFIG=$(pwd)/clusters/<cluster-name>/generated/auth/kubeconfig
kubectl get pods -n kube-system -l k8s-app=kube-controller-manager
- Restart each of the
controller-managerpods listed, one at a time.
kubectl delete pod <pod-name> -n kube-system
- Wait for the pod to restart before deleting the next instance.
Validate
To validate that octavia was successfully redeployed, complete the following steps:
-
Verify that all pods are running and that all nodes are ready.
-
Check the
kube-controller-managerlogs for errors. Two pods must show “Attempting to acquire leader list”. The third must show pod operations.Example of failures:
E0727 15:24:25.489296 1 service_controller.go:776] Failed to process service default/redis-slave. Retrying in 5m0s: error getting LB for service default/redis-slave: Invalid request due to incorrect syntax or missing required parameters. I0727 15:24:25.489337 1 event.go:218] Event(v1.ObjectReference{Kind:"Service", Namespace:"default", Name:"redis-slave", UID:"555924c0-9148-11e8-b0ee-fa163ed4312b", APIVersion:"v1", ResourceVersion:"1496775", FieldPath:""}): type: 'Warning' reason: 'CreatingLoadBalancerFailed' Error creating load balancer (will retry): error getting LB for service default/redis-slave: Invalid request due to incorrect syntax or missing required parameters. E0727 15:24:28.107999 1 attacher.go:191] Error checking if Volumes ([e4def50b-03c0-443b-bedb-d96bf3fe3d98]) are already attached to current node ("kubernetes-shk-cluster1-worker-8"). Will continue and try attach anyway. err=Invalid request due to incorrect syntax or missing required parameters. E0727 15:24:28.108048 1 operation_generator.go:184] VolumesAreAttached failed for checking on node "kubernetes-shk-cluster1-worker-8" with: Invalid request due to incorrect syntax or missing required parameters. E0727 15:24:28.108232 1 attacher.go:191] Error checking if Volumes ([318dc9ab-e131-4585-a213-88314ba6648d 1c8989cd-bb86-44ff-a5a2-562aec367f18]) are already attached to current node ("kubernetes-shk-cluster1-worker-1"). Will continue and try attach anyway. err=Invalid request due to incorrect syntax or missing required parameters. -
Deploy a load balancer instance to verify cluster connectivity to the OpenStack control plane using
kubectl apply -f ${filename}and the following manifest:
 apiVersion: v1
kind: Service
metadata:
  labels:
    app: test
  name: rax-test-lb
  namespace: rackspace-system
spec:
  ports:
  - port: 80
    protocol: TCP
    targetPort: 80
  selector:
    app: test
    tier: frontend
  sessionAffinity: None
  type: LoadBalancer
- Verify that octavia was created and has an external IP. This might take approximately 2-3 minutes.
- After the load balancer is created successfully, delete it by using the same manifest shown above.
Troubleshoot
Note
If you are using KaaS 1.5.0 or later, skip the ETS instructions.
Issue:
Kubernetes master and worker nodes with inconsistent results are trying to reach the metadata server, for example, curl http://169.254.169.254. ETS cannot get a token. Kubelet is not able to start clean.
Troubleshooting:
- Double-check the ETS functionality.
- Check
nova-metadata,neutron-metadata, and DHCP agents status on RPCR.
Resolution:
After a stack update, nova-metadata, neutron-metadata and DHCP agents were working, but it was required to recycle those services to have consistent results reaching metadata services from master and worker nodes.
Use a private Docker image registry
Rackspace KaaS deploys a private Docker image registry so that customers can store their Docker images securely. If you have just created a Kubernetes cluster, you might need to restart your local Docker daemon before you can use the registry. For an overview and basic operations, see Set up your cluster to use a private Docker image registry[1].
Inspect the registry certificate
The registry certificate and key were created in clusters/${KAASCTL_CLUSTER_NAME}/generated/tls/. If you need to inspect the registry certificate, run the following command
$ openssl x509 -in clusters/${KAASCTL_CLUSTER_NAME}/generated/tls/managed-services.crt -text -noout
[1] Set up your cluster to use a private Docker image registry
SSL certificates rotation
KaaS generates x.509 certificates during the Kubernetes and Managed Services deployment by using OpenSSL. For security reasons, some of those certificates must be updated on a regular basis. The certificate update policy might vary for different components and company security requirements.
The following major events require certificate updates:
- Security breaches when private keys might get exposed or a malicious actor accesses the keys and can break into other systems that trust those keys or masquerade them as a trusted system.
- Certificate and key expiration time.
Kubernetes certificates
Kubespray supports automatic certificate rotation for etcd and Kubernetes components. However, after you update the certificates, you must manually delete all the pods that are deployed outside of the kube-system namespace and that require service tokens.
Managed services certificates
The install-certs.sh installs the managed services certificates to the operating system trusted certificates. You do not need to update the certificates often, but when you need to, a Rackspace support engineer manually updates the certificates.
Amazon EKS
TBA
OpenStack certificates
OpenStack uses SSL certificates for load balancer endpoints. All certificates are self-signed and typically are valid for up to ten years or so. In the case when a certificate is compromised, the team responsible for OpenStack deployments updates the certificate manually.
Request to update a certificate
When a certificate expires or a certificate authority (CA) is compromised, customers can request an update to an SSL certificate.
A certificate update involves the following steps:
- The customer creates a CORE ticket that explains the reason for the certificate update request, such as certificate expiration or breach in security. If the customer uses a third-party CA, the customer provides all the related information about the CA.
- The support team representative updates the certificates as required and resolves the ticket.
Backups and disaster recovery
Rackspace KaaS uses Heptio™ Velero, previously known as Heptio Ark, to create backups of the Kubernetes cluster state. The etcd data is stored in object storage, such as Swift, and the persistent volume snapshots are stored in block storage, such as cinder.
The volume snapshots are named with prefixes of ${KAASCTL_CLUSTER_NAME}-ark-. The backup data is stored in a bucket named ${KAASCTL_CLUSTER_NAME}-backups.
KaaS automatically creates backups for all namespaces on a daily basis at 2:00 AM in the host’s timezone and stores them for 3 days. In the current release, changing these settings is not supported.
Configure Ark
Ark uses kubeconfig to perform Kubernetes operations. Therefore, you might want to export this variable rather than providing it with every command:
export KUBECONFIG=<ABSOLUTE_PATH_TO_KUBECONFIG>
To run Ark commands, you can either download the client or use the following Docker image:
docker pull gcr.io/heptio-images/ark:v0.9.3
alias ark='docker run -it --rm -v ${KUBECONFIG}:/config -e KUBECONFIG=/config gcr.io/heptio-images/ark:v0.9.3'
Ark runs in the rackspace-system namespace. You need to specify this namespace by using the -n flag in the command below.
Create a backup manually
You can create a backup manually at any time.
To manually create a backup of a namespace at any time, follow these steps:
- Create a backup:
ark -n rackspace-system backup create <NAME_OF_BACKUP> --include-namespaces <NAMESPACE_TO_BACKUP>
NAME_OF_BACKUP- a descriptive backup name, such asngingx-backup.NAMESPACE_TO_BACKUP- a namespace that you want to back up, such asdefault. You can specify multiple namespaces.
- Check the backup’s status by running the following command:
ark -n rackspace-system backup describe <NAME_OF_BACKUP>
Restore from a backup
This section describes how to restore a specific namespace or an entire cluster’s state.
Namespace
Applying the restore operation reverts the namespace or namespaces in the backup to their state at the time of the backup.
To restore a namespace state, follow this procedure:
- Restore a namespace state:
ark -n rackspace-system restore create <NAME_OF_RESTORE> --from-backup <NAME_OF_BACKUP>
NAME_OF_RESTORE- the name of the restore.NAME_OF_BACKUP- the name of the backup from which to restore the namespace state.
- Check the restore operation status by running the following command:
ark -n rackspace-system restore describe <NAME_OF_RESTORE>
Cluster
To restore an entire cluster, complete the following steps:
NOTE: Issuing a restore that includes one or more PVs fails unless the volumes are independently transfered, snapshotted, and all references are updated in the backup JSON files in swift.
- Deploy a new cluster as described in Create a Kubernetes cluster [^1].
- Grant the new cluster’s project a permission to write to the old cluster’s container. Change the environment variables below to their correct values. Note that some values are specific to the old cluster (
CLUSTER_1) and some values to the new cluster (CLUSTER_2).
docker run --rm --env OS_AUTH_URL=${OS_AUTH_URL} --env OS_USERNAME=${CLUSTER_1_OS_USERNAME} --env OS_PASSWORD=${CLUSTER_1_OS_PASSWORD} \
  --env OS_PROJECT_ID=${CLUSTER_1_OS_PROJECT_ID} --env OS_IDENTITY_API_VERSION=3 --env PYTHONWARNINGS="ignore:Unverified HTTPS request" \
  quay.io/rackspace/openstack-cli:latest swift --insecure \
  post --read-acl "${CLUSTER_2_OS_PROJECT_ID}:*,.rlistings" --write-acl "${CLUSTER_2_OS_PROJECT_ID}:*" ${CLUSTER_1_CLUSTER_NAME}-backups
The command above authenticates to OpenStack as the user of the old cluster and grants read and write permissions to the new cluster’s project ID on the old cluster’s backups container.
- Edit the Ark configuration file:
kubectl -n rackspace-system edit -f deployments/stable/ark/config.yaml
- Change the
backupStorageProvider.bucketfield in the configuration file above to the name of the old cluster’s container (${CLUSTER_1_CLUSTER_NAME}-backups). - Change the
restoreOnlyModefield totrue. - Save and exit.
- Perform a restore:
ark -n rackspace-system backup get
# use one of the listed backups in the <BACKUP-NAME> below
ark -n rackspace-system restore create <NAME_OF_RESTORE> --from-backup <BACKUP-NAME>
The commands above list the backups that the cl. ster knows about and restores from one of those backups, respectively.
- Verify the restore:
ark -n rackspace-system restore describe <NAME_OF_RESTORE>
- Revert the Velero configuration file:
kubectl -n rackspace-system edit -f deployments/stable/ark/config.yaml
- Change the
backupStorageProvider.bucketfield in the configuration file above to the name of the new cluster’s container (${CLUSTER_2_CLUSTER_NAME}-backups). - Change the
restoreOnlyModefield tofalse. - Save and exit.
Updated 5 months ago